Understanding JavaScript impact
Using SpeedCurve RUM to diagnose issues with JavaScript execution
JavaScript remains the number one cause of poor performance and frustrating user experiences. Despite this, it remains one of the most difficult aspects of page performance to measure and monitor. In this guide, we focus on the performance implications of script execution. JavaScript can also cause performance issues when not being loaded asynchronously, which you can learn more about here: Blocking JS & CSS.
Fortunately, we have made some strides in this area which has given way to new metrics and terminology. Unfortunately with that comes added complexity when trying to debug performance issues related to JavaScript. This guide is intended to provide some clarity and hopefully some productive workflows that can help you more definitely find and fix issues related to JavaScript.
Is it a problem?
This is the first question you want answered. JavaScript issues can manifest in different ways, but tend to have a pretty strong impact on these high level metrics:
- Interaction to Next Paint (INP) - One of the three Core Web Vitals focused on measuring responsiveness to user input. This metric is only available in RUM (Chrome and Firefox as of this writing). This metric gets attention in organizations due to it's popularity and implied impact on SEO.
- Total Blocking Time Total Blocking Time (TBT) - This synthetic only measurement (Chrome) has been considered a good proxy for INP in a lab setting. You'll see this metric in current versions of Lighthouse and other lab monitoring, including SpeedCurve synthetic. While the name is slightly misleading, TBT focuses on measuring long running JavaScript that is blocking the main thread. It's a bit more of a technical metric, good for baselining in synthetic to identify any regressions due to first or third-party JS.
- LoAF Total Blocking Duration (TBD) - currently in Beta at SpeedCurve, this is a RUM only metric (Chrome) that captures the sum of all blocking time when a browser would not be able to respond quickly to interactions. It is measured from the start of the page load until the visitor leaves the page (or 60s, whichever happens first). It's new, and subject to change, but has great promise due to the ability to attribute problematic scripts in the wild.
These are not the only metrics that can be impacted by poor performance JavaScript, but they are the most notable. For the most part, focusing on blocking time covers impact that would be seen in other metrics such as Largest Contentful Paint (LCP) or even First Contentful Paint (FCP).
You can find these metrics throughout the product. A simple place to start is the Vitals dashboard. If you are using RUM, you will see values for these and other CWV metrics with an indicator (RYG) of their respective health.

What is causing the problem?
The primary cause of issues related to top level metrics like INP is excessive script execution which 'blocks' the browser's main thread. Blocking tasks can prevent the browser from updating or responding to input. Blocking tasks that take longer than 50ms are known as LongTasksand are captured for both RUM and synthetic. The issue with longTasks is that they are somewhat incomplete with little to no attribution.
Fortunately, longTasks have been superseded (in RUM only for now) by Long Animation Frames (LoAF). LoAFs tell us when the browser is unable to render for more that 50ms and also gives us attribution as to which script(s) were responsible.
LoAF metrics include:
- LoAF Entries - count of Long Animation Frames for a page.
- LoAF Total Duration - sum of all Long Animation Frames for a page.
- LoAF Total Blocking Duration (TBD) - sum of all LoAF blocking durations.
Scripts that impact INP as well as TBD are now collected and aggregated in the corresponding areas of the Vitals dashboard.
Troubleshooting JavaScript issues in SpeedCurve
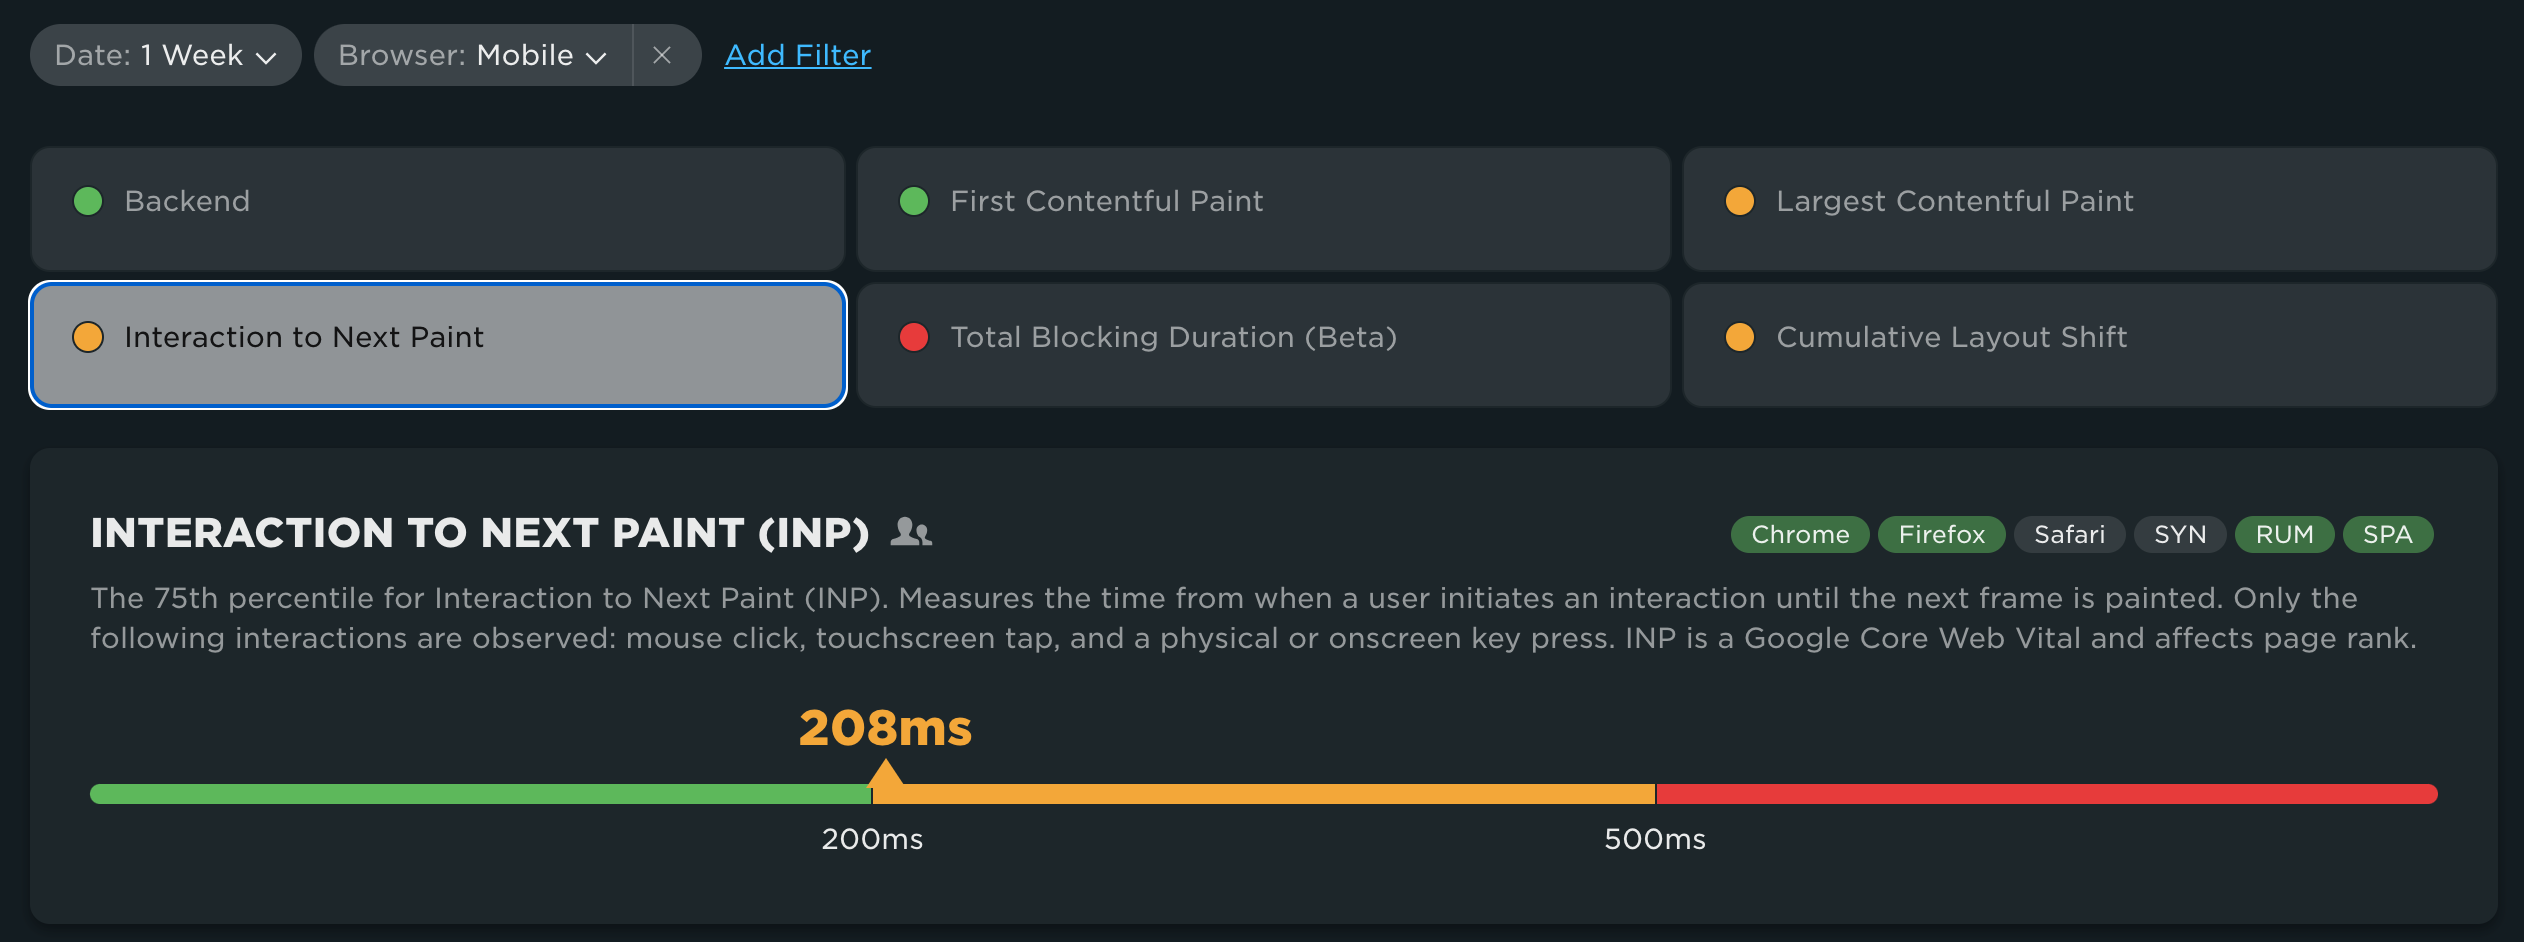
The INP section of the Vitals dashboard is the best starting point for identifying an issue with INP as well as the other Core Web Vitals.
In this case, INP for mobile users is just past the threshold for 'needs improvement'.
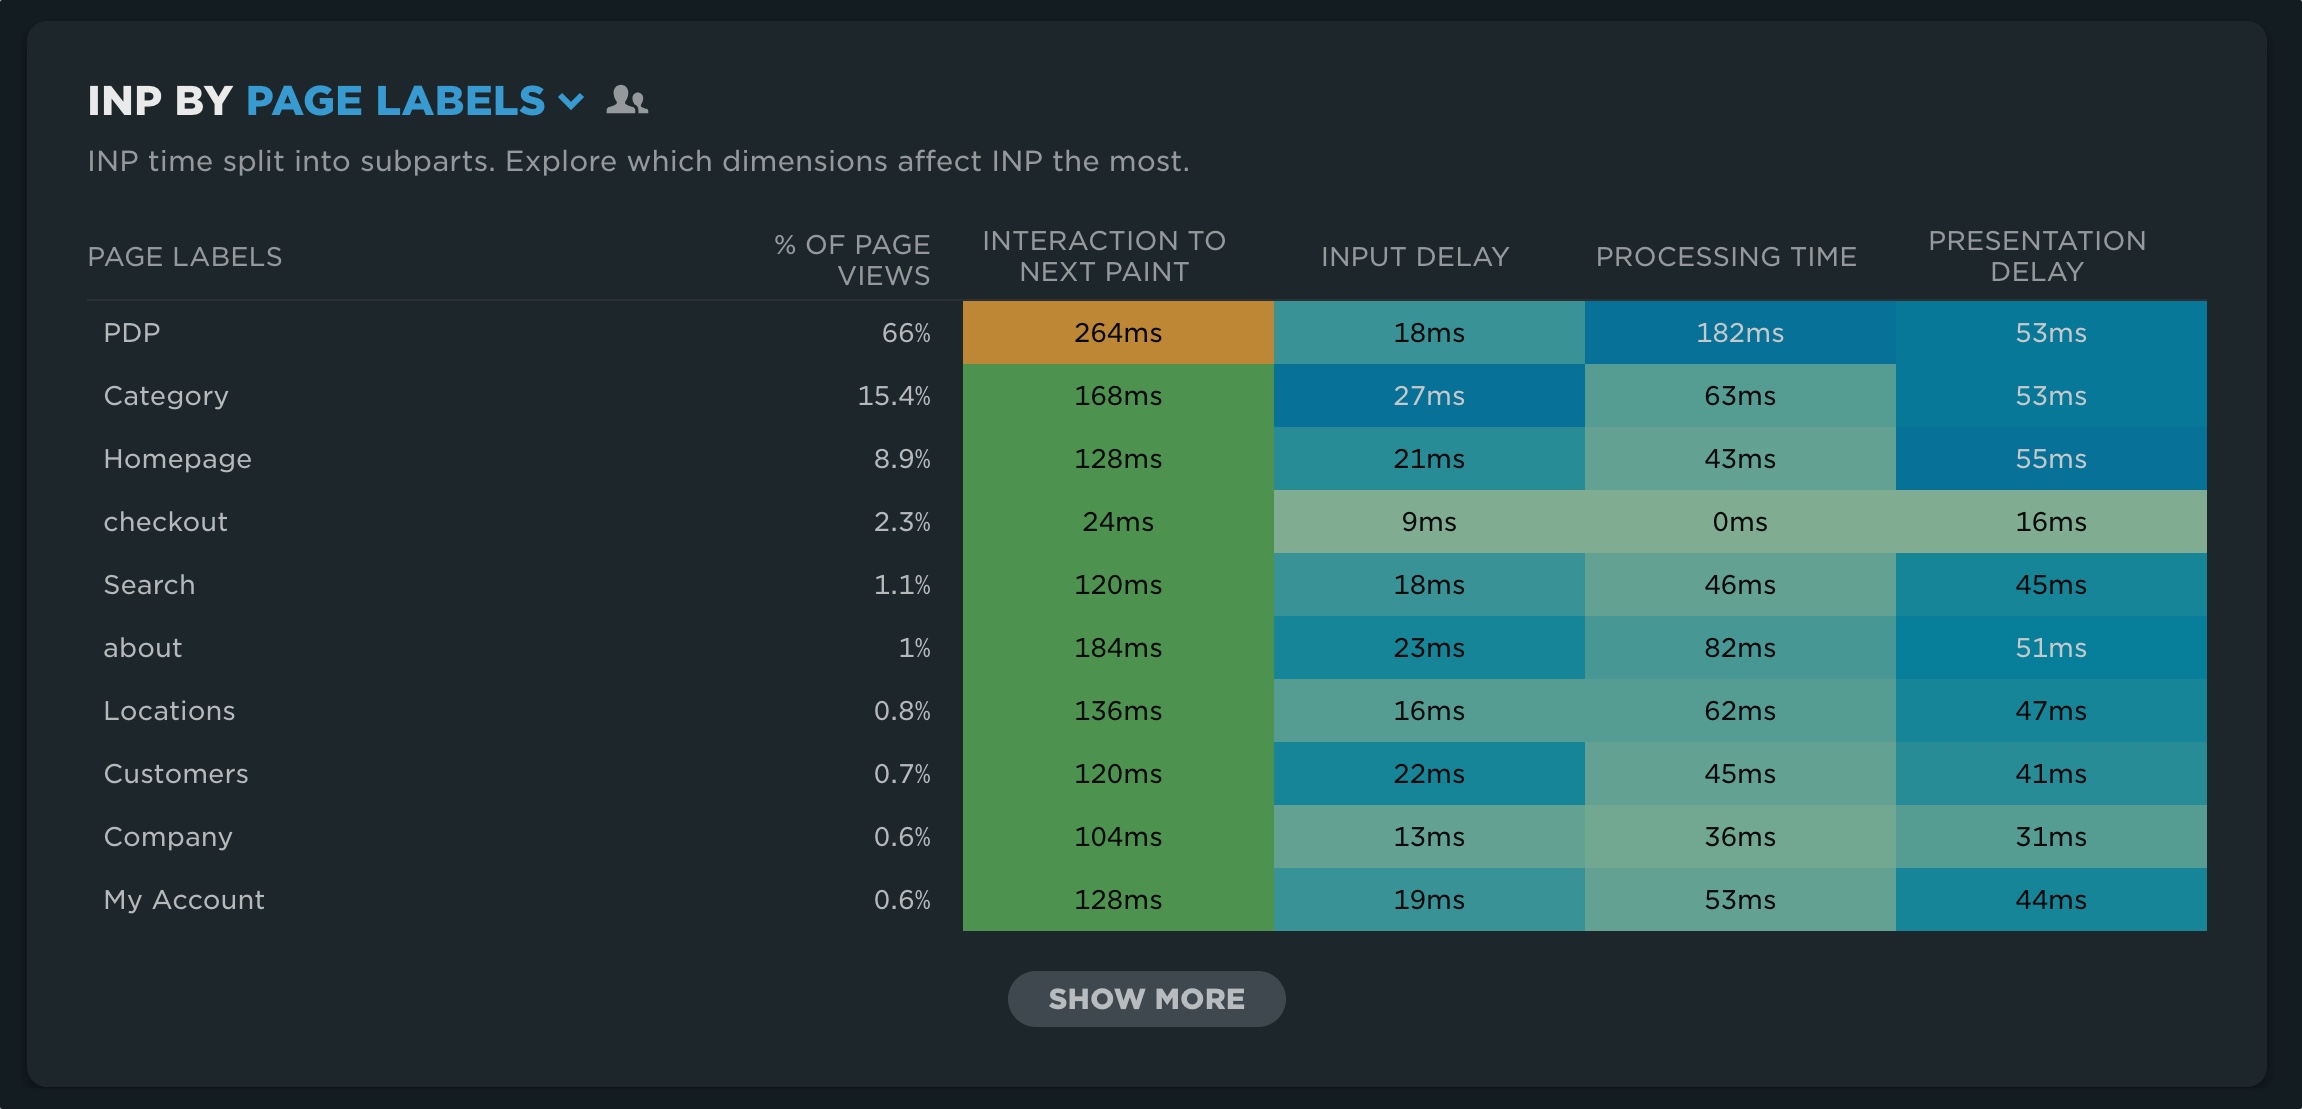
While the majority of pages seem to be just fine ('good'), PDP pages seem to be the primary culprit for INP.
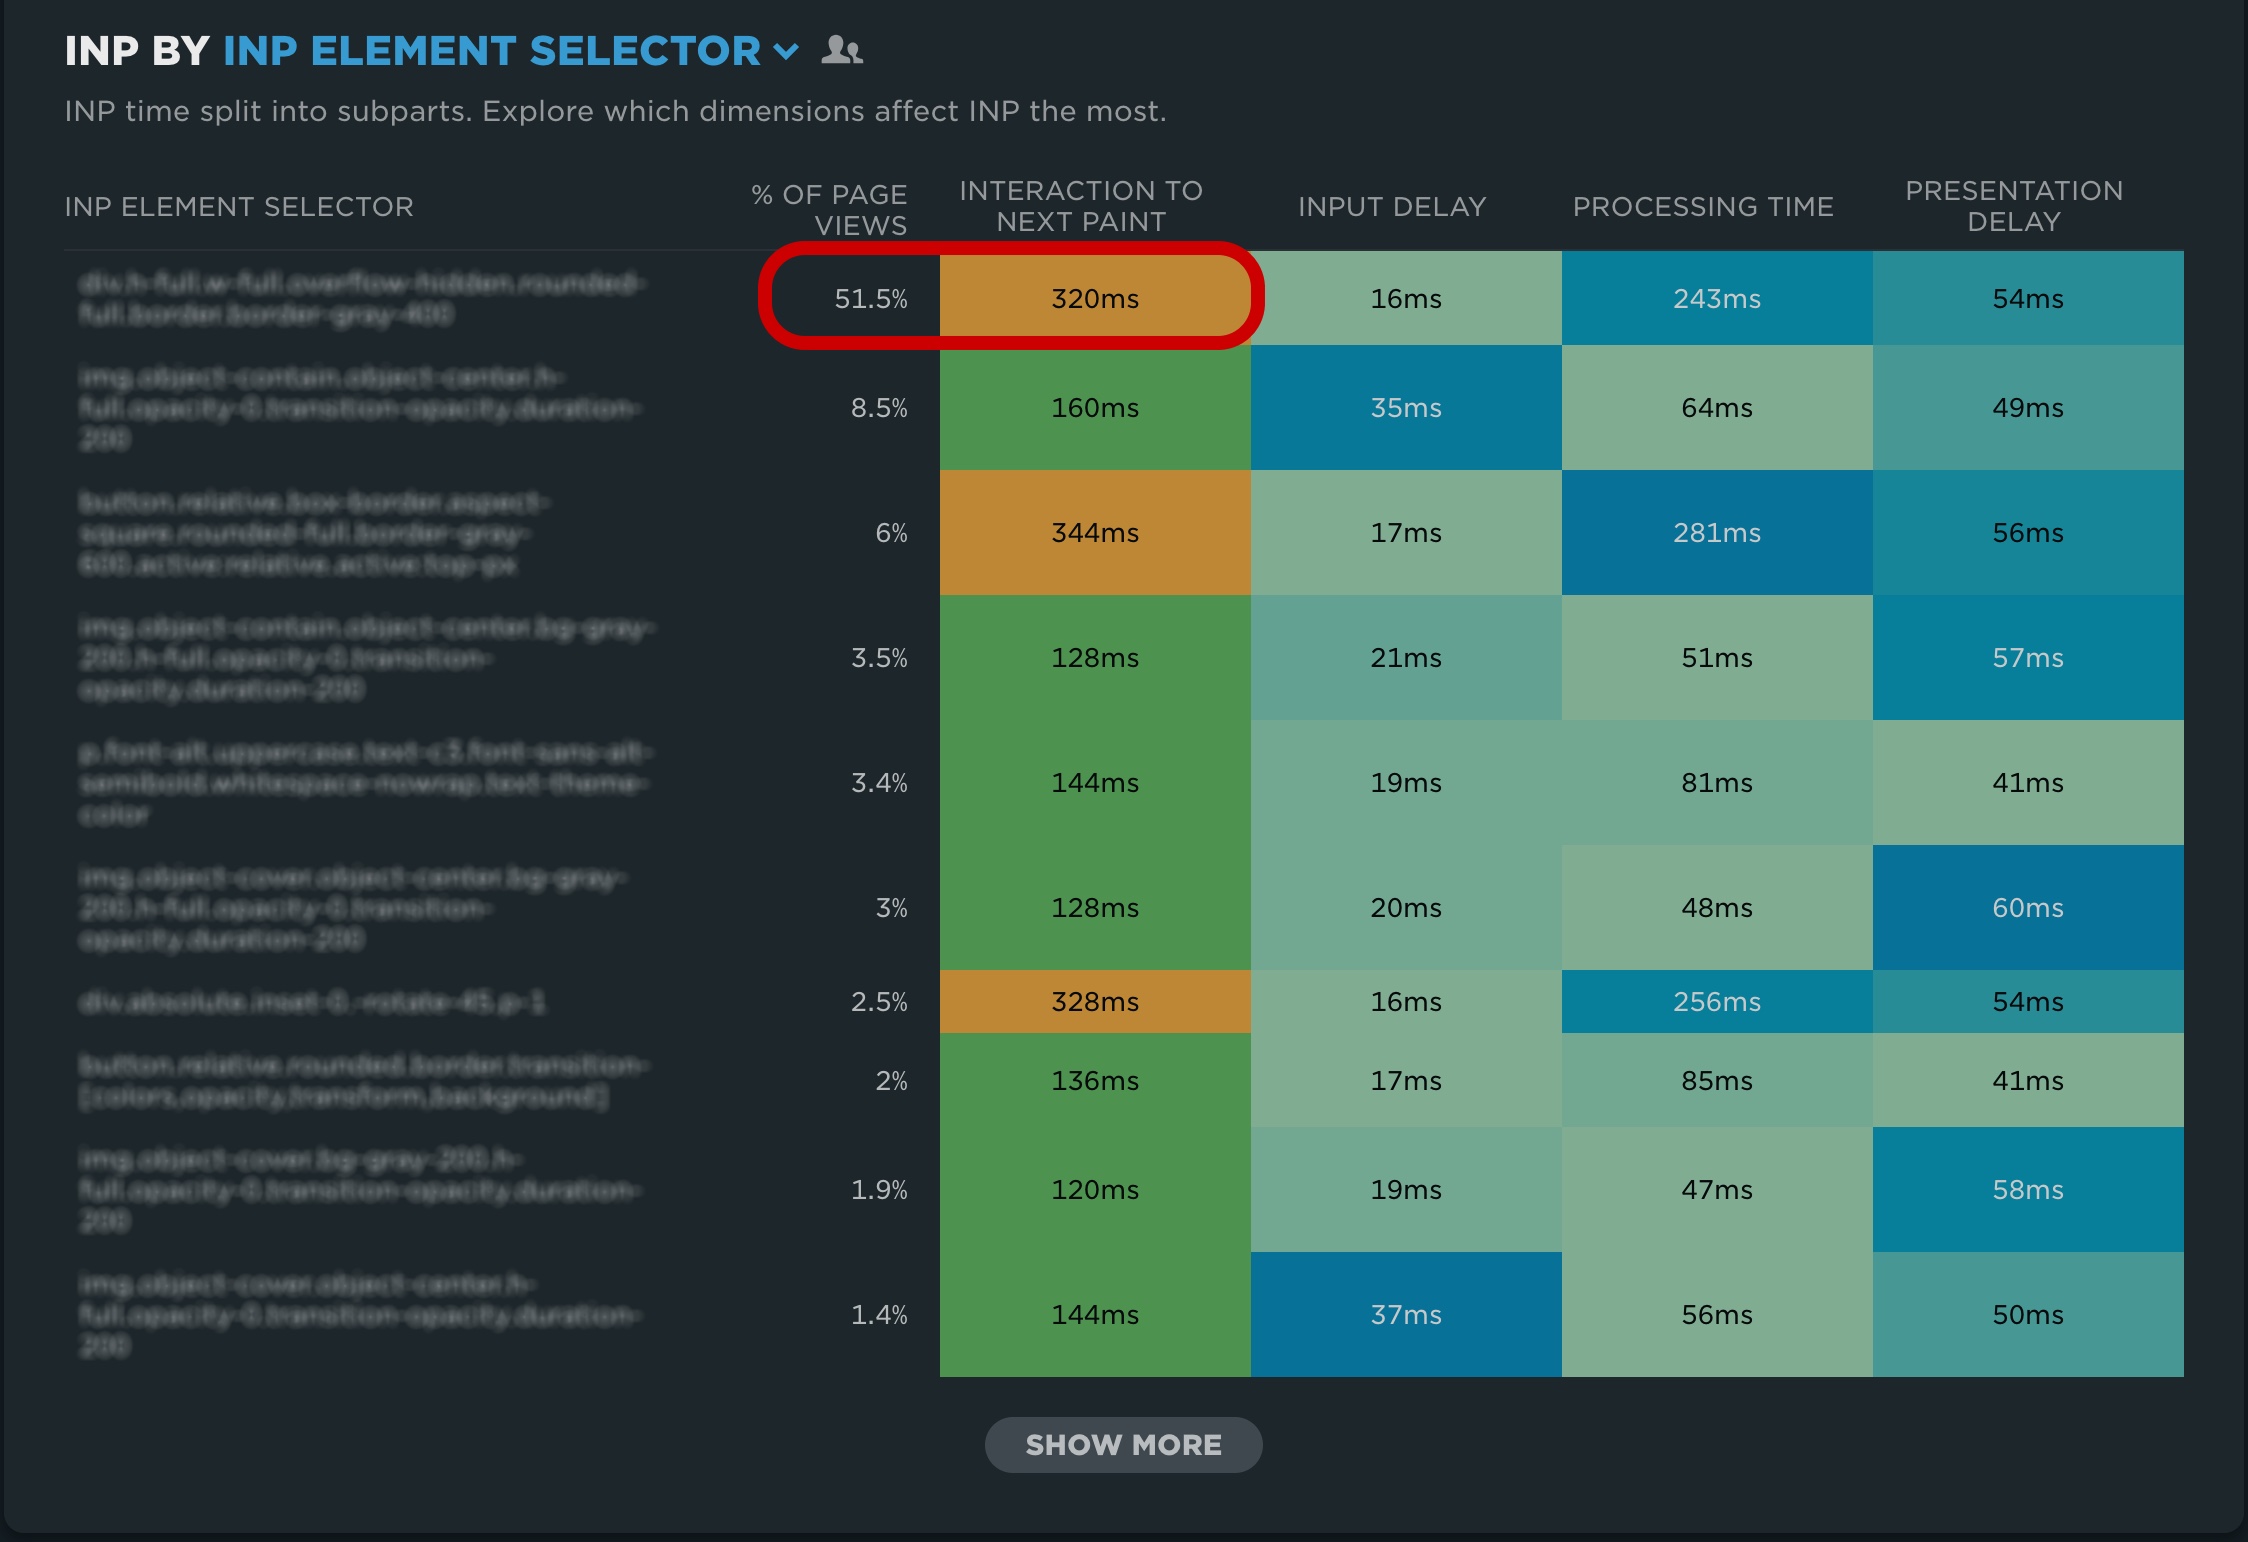
Filtering the dashboard to the PDP page and inspecting INP by Element Selector tells us the element users are interacting with most often. In this case, while obfuscated for privacy, the element is the add to cart button.
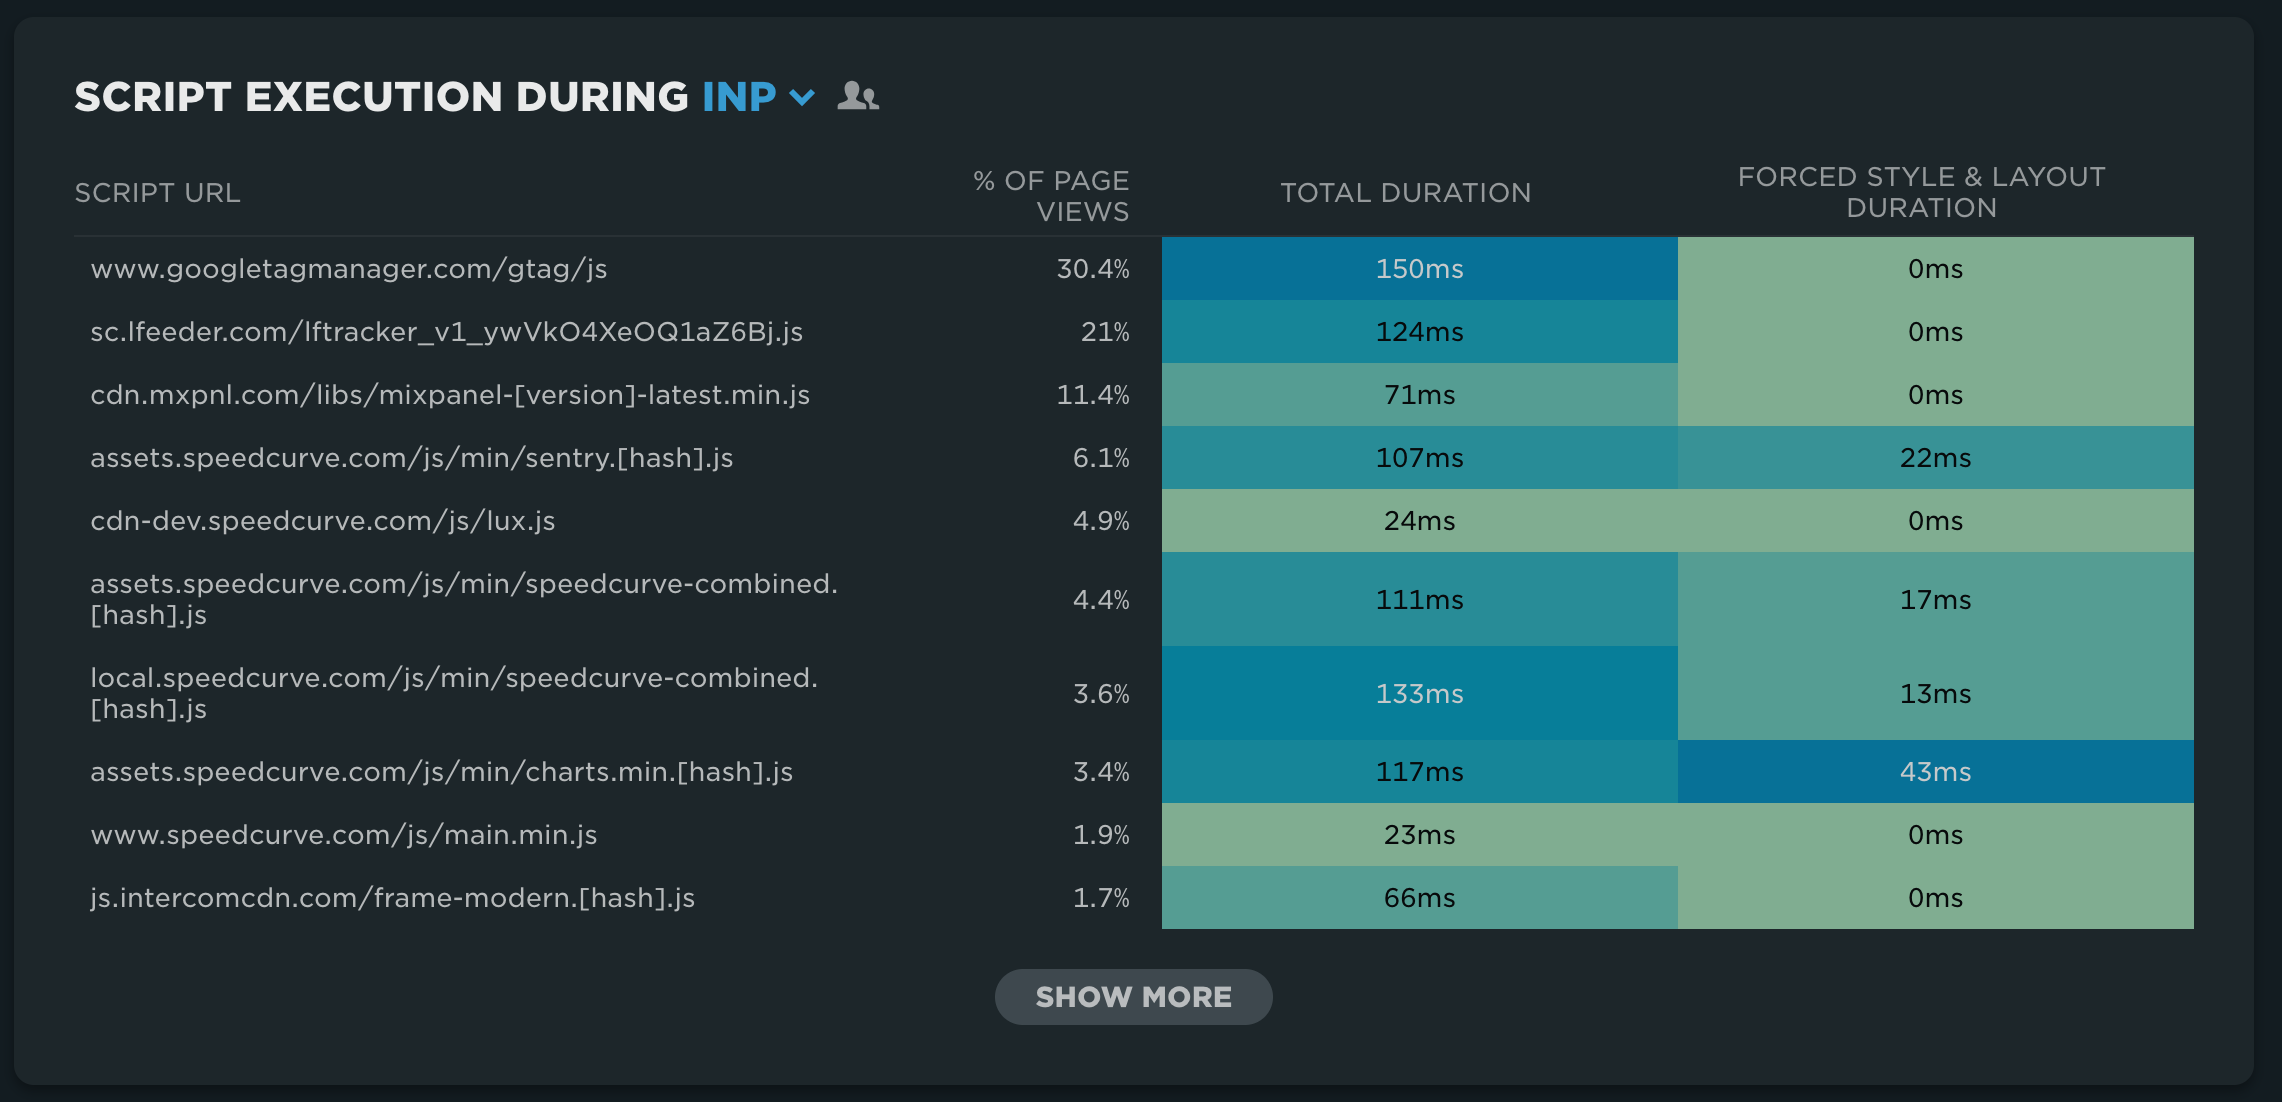
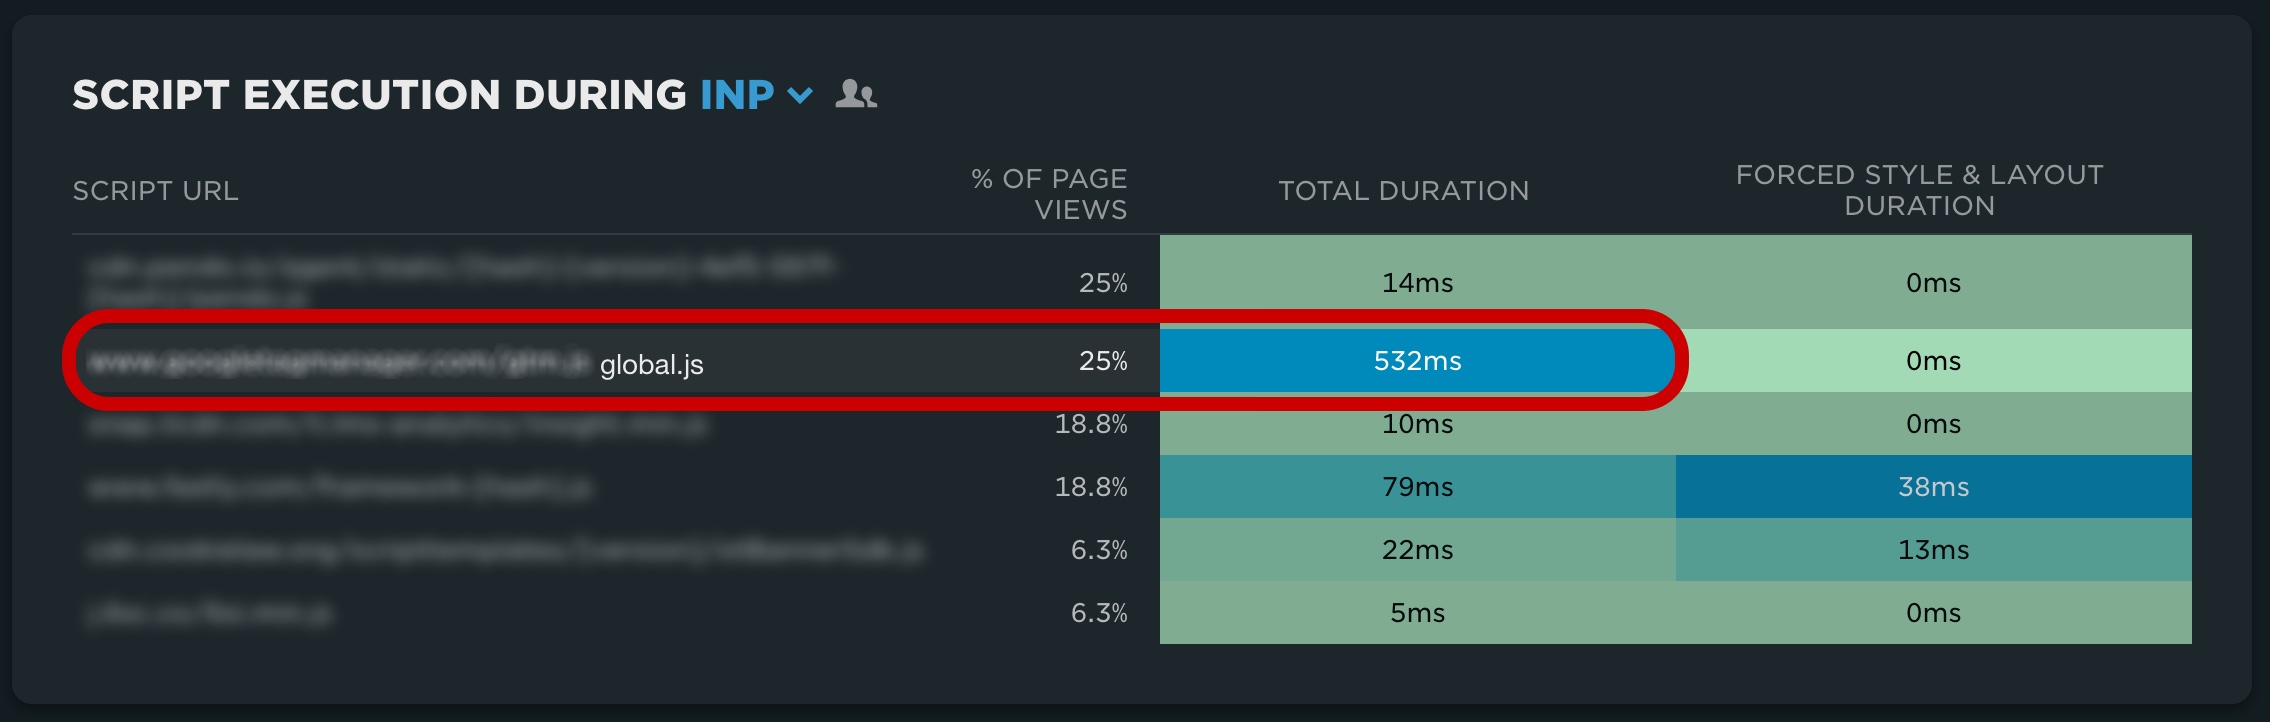
Further below, the script execution during INP table identifies the global.js script duration for the PDP page is the biggest offender.
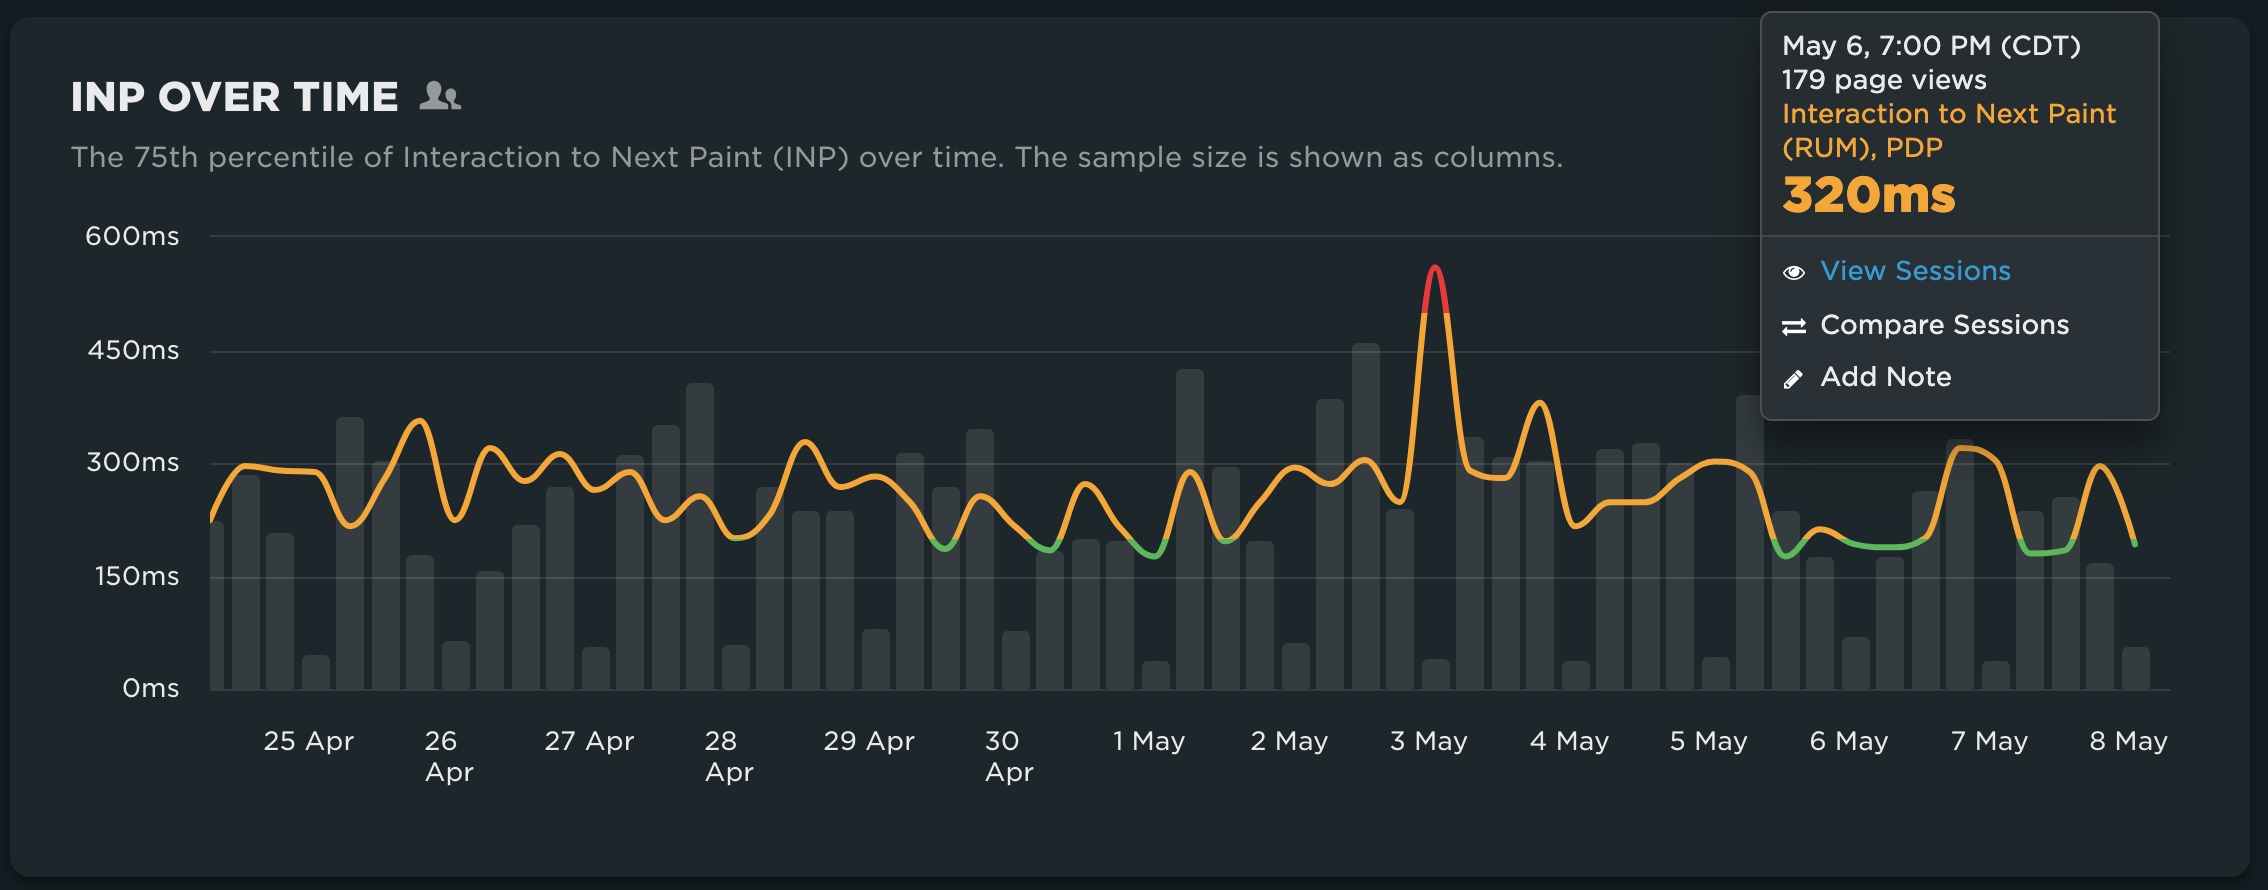
In order to look at some example sessions, click on the INP time series and select 'View Sessions'.
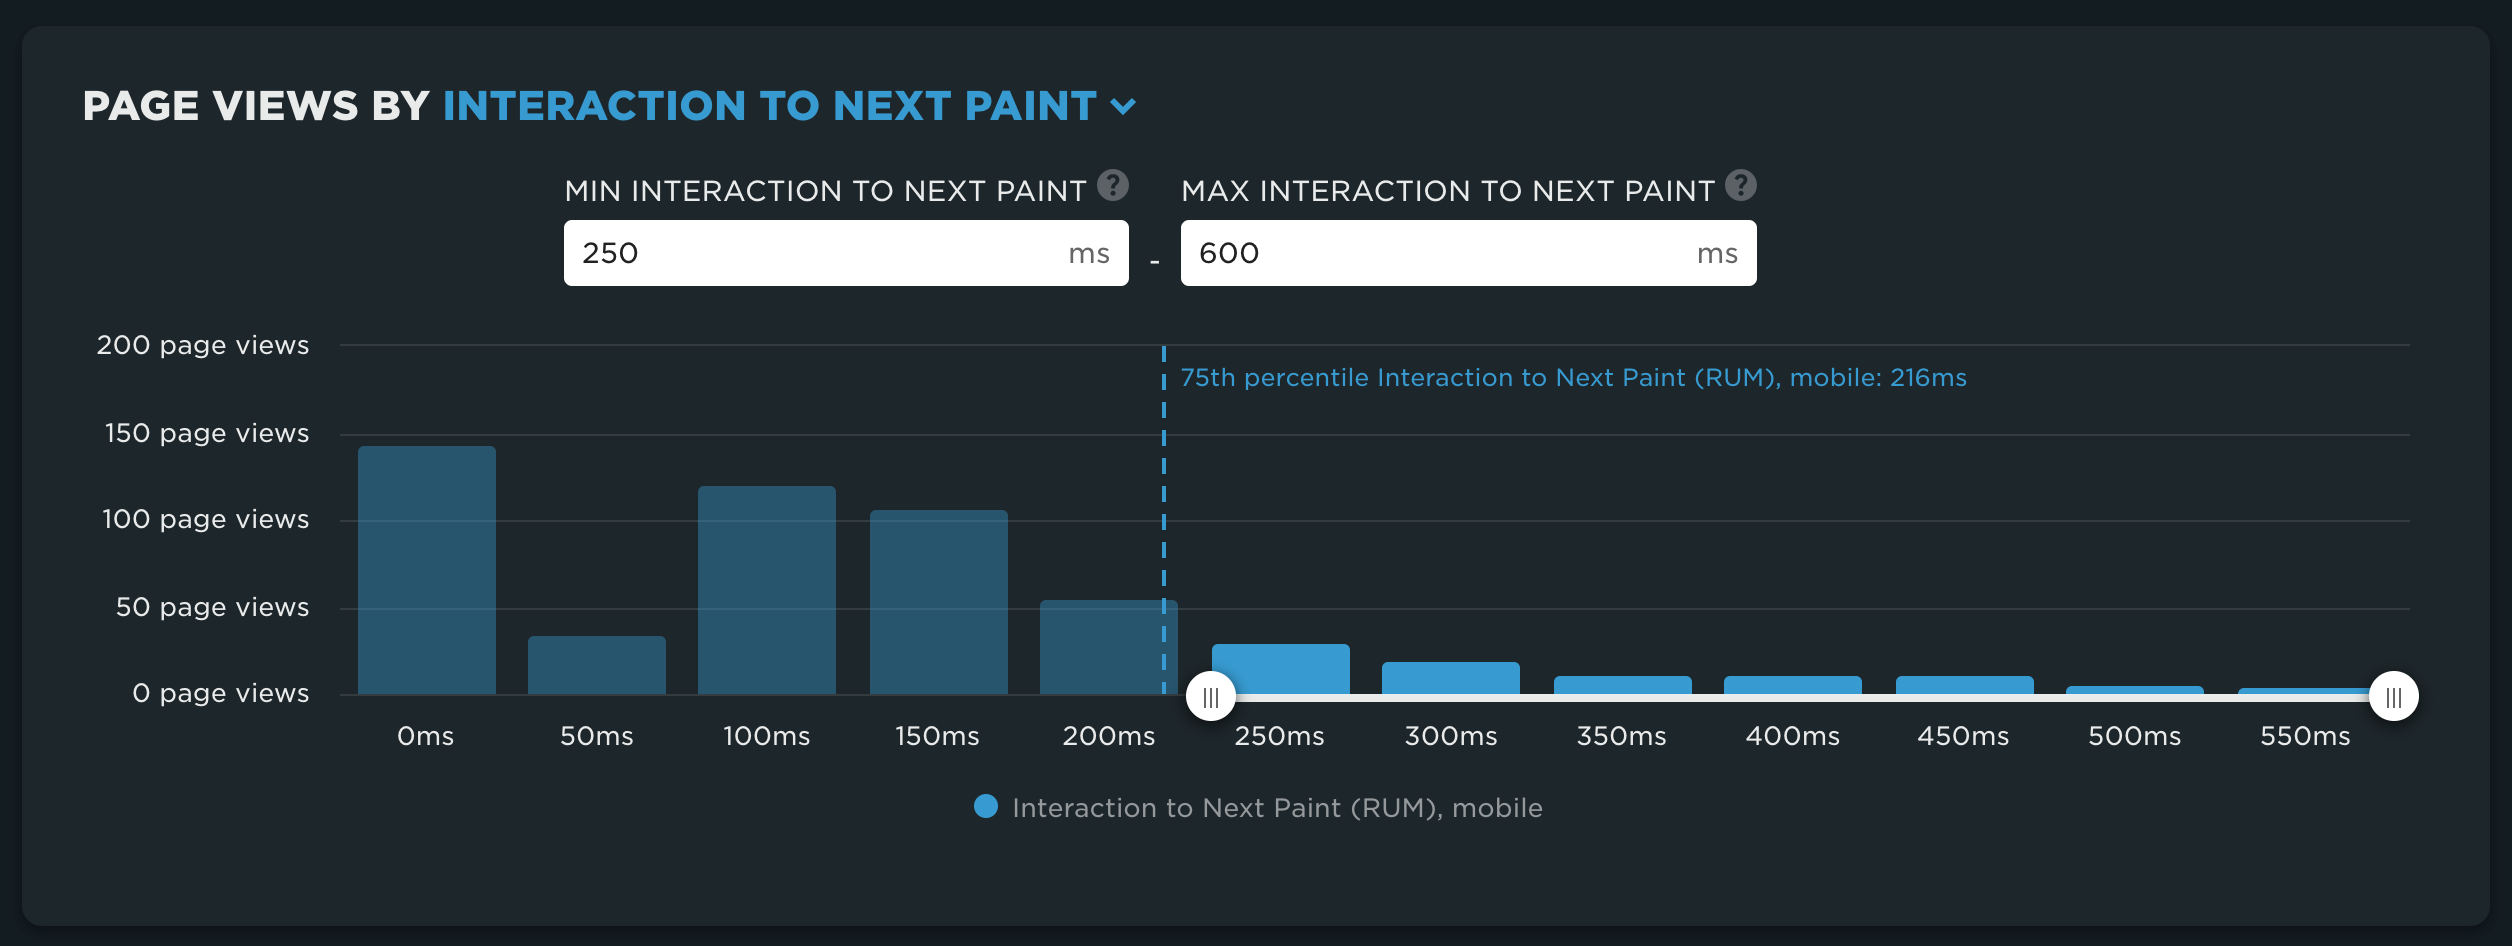
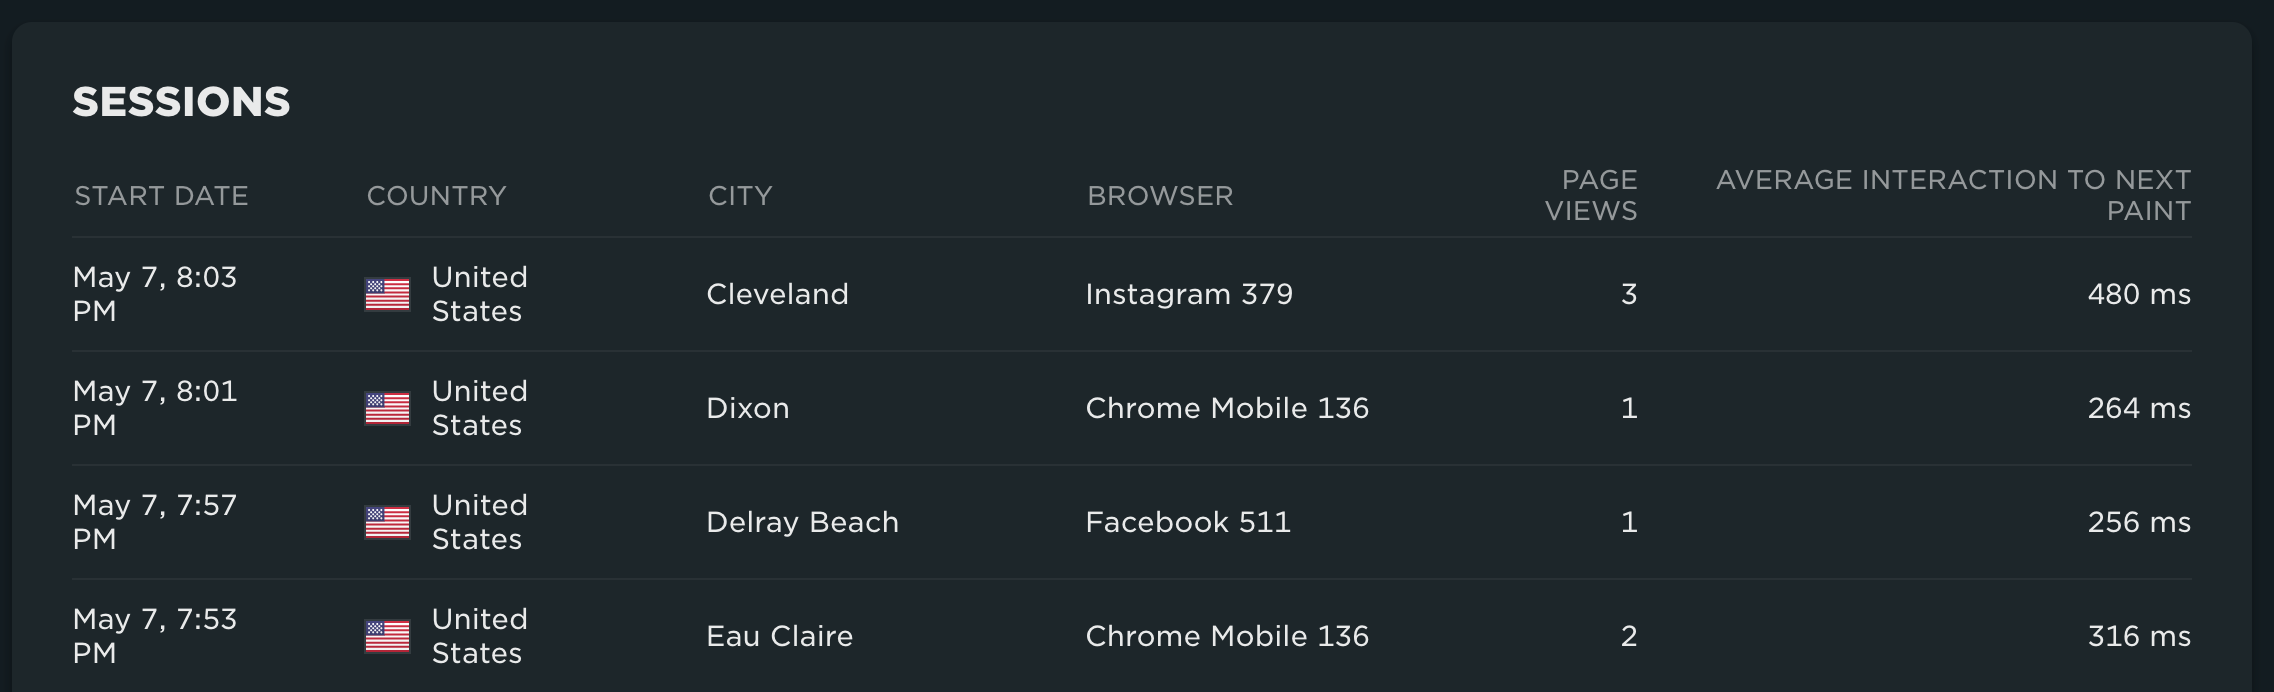
The RUM sessions dashboard is filtered to the PDP page for that specific point in time. I've further refined the sessions to identify INP values over 250ms.
Individual sessions that match the criteria are listed at the bottom of the Sessions dashboard. Clicking on a session will drill into the Session Details.
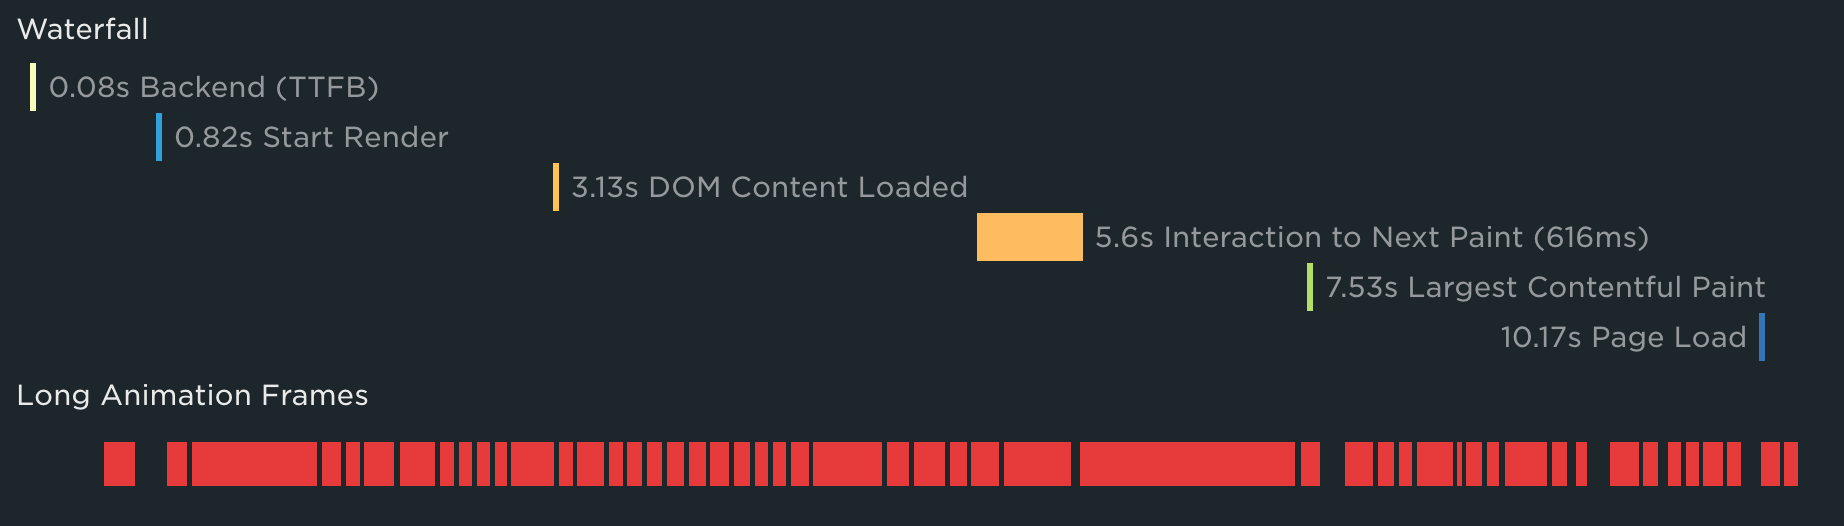
Examine the waterfall for each page in the session to identify LoAFs that occur during INP and we see an example of global.js contributing to INP processing time.
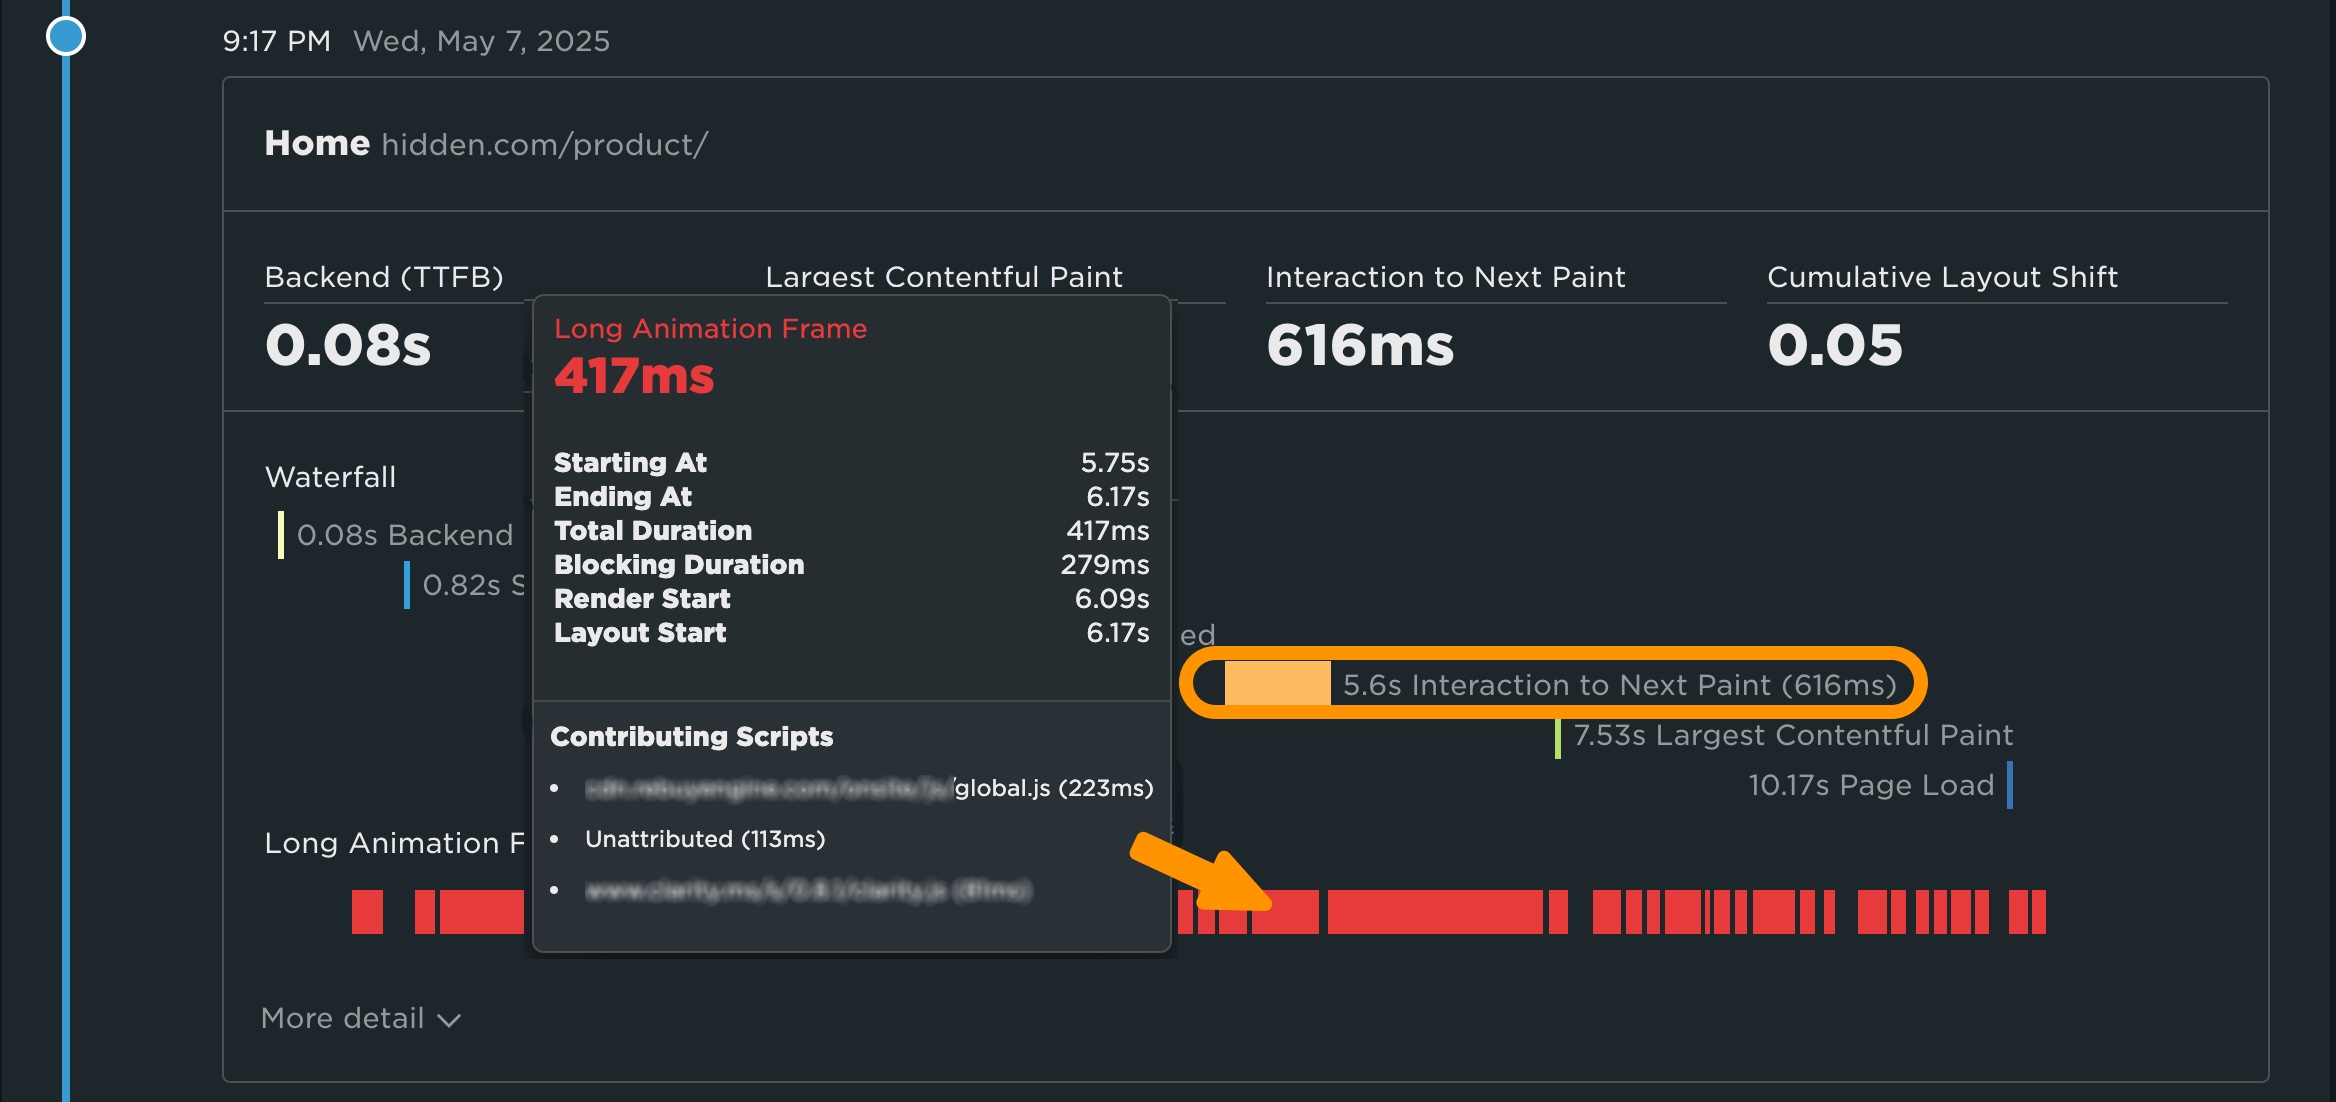
It's worth noting that this approach can be used for troubleshooting other metrics discussed earlier. In this same instance, we can also observe that the LoAFs also appear to delay Largest Contentful Paint.
For more information on debugging INP, including how to profile in Chrome DevTools, check out this blog post.
Updated about 1 year ago