Metrics
How to add custom metrics to SpeedCurve RUM and Synthetic
In SpeedCurve, a metric refers to a quantifiable measurement used to assess the performance of your application. Custom metrics provide additional insights into performance, helping to identify bottlenecks, establish performance budgets, and ensure optimal user experience.
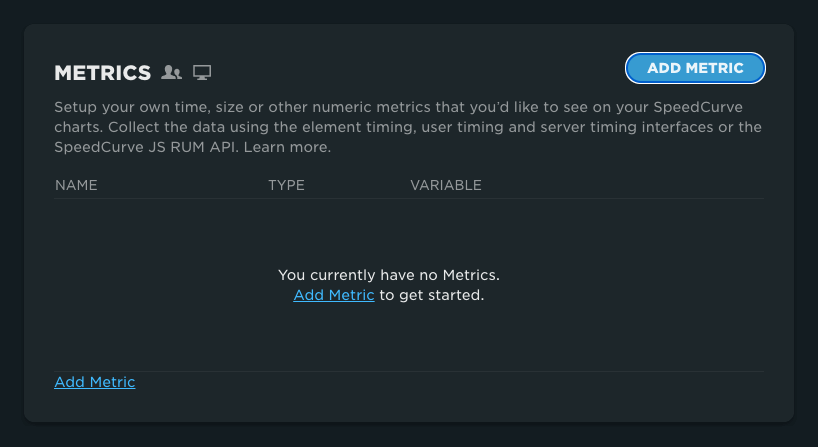
To add a metric, navigate to Settings-> Custom Data -> click 'Add Metric'

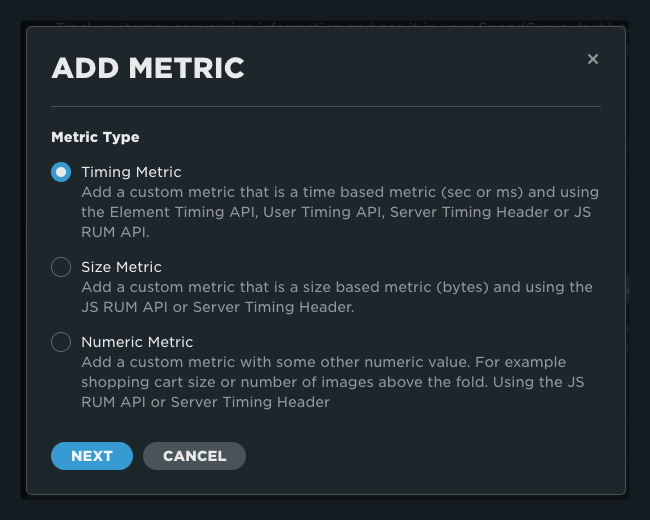
Web performance metrics are typically collected and analyzed to evaluate the speed, availability, and reliability of a website. In SpeedCurve, custom metrics can be defined as three different 'types'. Timing, Size, and Numeric.

Timing
Timing metrics are measurements of a duration or span of time. When defining a timing metric in SpeedCurve, you can choose from four methods of collection including Using the JS RUM API, Using Server-Timing headers, Using Element Timing, and Using User Timing. Timing metrics will be displayed as seconds in your charts. Some examples of custom timing metrics include database query time, loading of fonts, and Add to Cart element loaded.
Size
Size metrics can be used to display the measurement in bytes of an object. You can choose from two different methods of collection including Using the JS RUM API and Using Server-Timing headers. Examples of custom size metrics include LCP element size, memory allocation and cookie key size.
Numeric
Numeric metrics can be used to reflect any other numeric value you want to collect. Methods of collection include Using the JS RUM API and Using Server-Timing headers. Examples include Items in Cart, Order Total, and number of impressions.
Updated 11 months ago