Add custom data
Track any data you want (cart size, A/B tests, conversion info) using the addData API.
SpeedCurve RUM includes numerous out of the box metrics collected from real user web pages such as page load time, DNS lookup time, DOM size, etc. But sometimes there's other information specific to your site that you would like to track.
This additional data that is specific to your website is called Custom Data. Examples include:
- Business metrics such as cart size and conversion information.
- Performance metrics such as download time for specific resources or number of search results.
- A/B testing information such as the name of the test bucket.
- User information such as account ID or username.
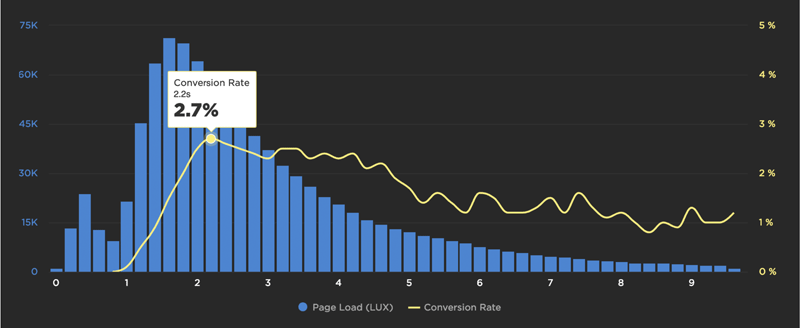
Here's an example of how a customer added their own conversion data to create a correlation chart that demonstrates the powerful relationship between start render and conversion rate:

How to add Custom Data
You can add Custom Data to RUM by using the LUX.addData API:
LUX.addData(name, value);The examples listed above could be captured like this:
LUX.addData('cartsize', 128);
LUX.addData('jsonresptime', 744);
LUX.addData('abtest_buttoncolor', 'blue');
LUX.addData('username', 'steve_souders');
Important note: The total amount of custom data that can be included in a page view is limited to 500 characters. We recommend choosing short variable names if you think you will go over this limit.
How to remove Custom Data
Custom data is removed when the user performs a full page load. If you have a single page application, you may want to remove custom data between SPA page transitions. You can do this by calling LUX.addData with a null or undefined value:
LUX.addData('username', null);
LUX.addData('username', undefined);
LUX.addData('username');
Adding Custom Data to Settings
Once you've added the LUX.addData JavaScript to your pages, as shown in the previous examples, the next step is to add them to your Settings. See Custom Data documentation for more detail.
Using Custom Data
Custom Data variables setup for plotting (with types "Seconds", "Milliseconds", or "Currency") show up in the list of metrics in Favorites in the "Custom Metrics" section. You can select them just like any other metric to generate new, custom charts. For example, you might create a chart that plots "Cart Size" and "Page Load" to see if faster pages generate more revenue.
Custom Data variables setup for segmenting (with type "Other") show up in the Favorites and RUM dashboards under "Custom Data". You can choose the variable name (e.g., "Button Color AB Test") and choose from the set of possible values.
Note that after adding a new variable it can take up to 24 hours before it is available as an option in the SpeedCurve dashboards.
Updated 8 months ago