SpeedCurve RUM vs CrUX data
Why your RUM numbers may not match up with the Chrome User Experience Report (CrUX) and what to do about it.
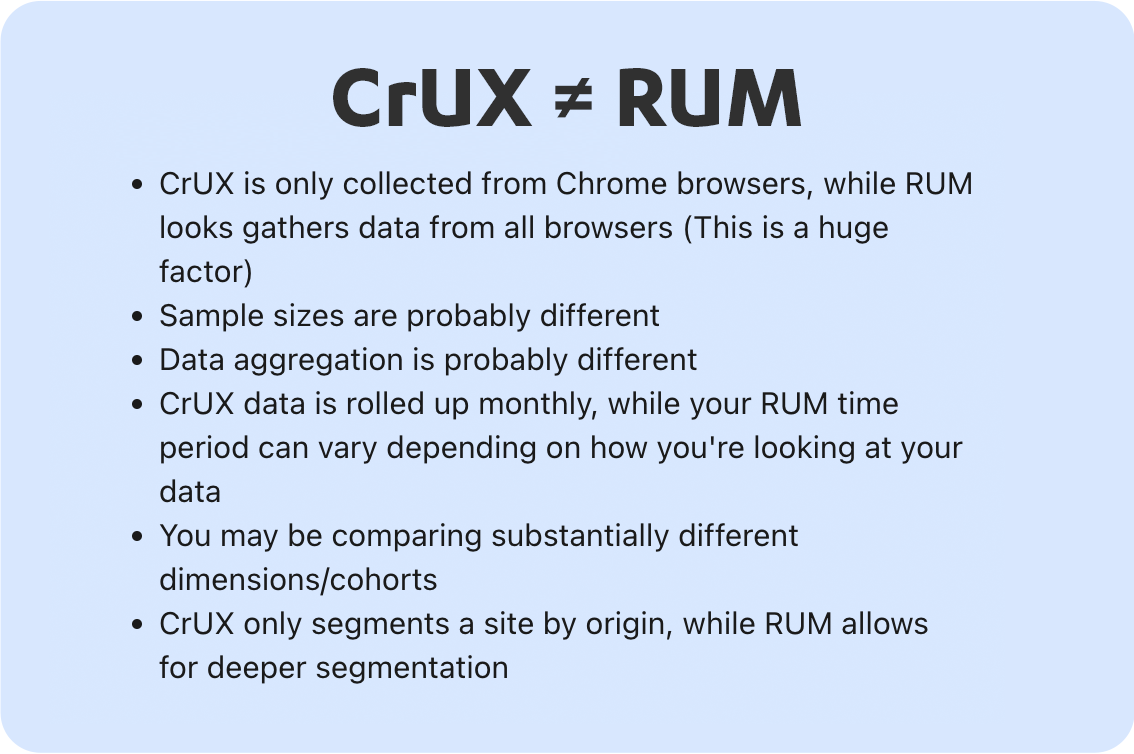
The Chrome User Experience Report (CrUX) is a public resource from Google that provides real user measurements (RUM) for millions of sites. This data is referenced throughout many of their other products such as Page Speed Insights (and PSI API), Big Query and Google's Search Console. While the metrics from both RUM and CrUX are collected by the same methods, there are a few reasons why they may not match up exactly with one another.
CrUX data is only collected from Chrome browsers
This is the most obvious reason you'll see discrepancies. SpeedCurve RUM collects data from any capable browser where the site owner embeds our JavaScript snippet. CrUX only includes data from Chrome browsers.
Your sample sizes are likely different
There are a number of reasons why your sample sizes may not match between RUM and CrUX. This doesn't necessarily point to issues with the data reported, but it's important to know that in order for Chrome to collect data from their end users, they must have:
- Opted-in to syncing their browsing history
- Have not set up a Sync passphrase
- Have usage statistic reporting enabled
On the RUM side, if you've set your sample rate too low this may also create some variance in the numbers reported. Here are some best practices for setting your RUM sample rate.
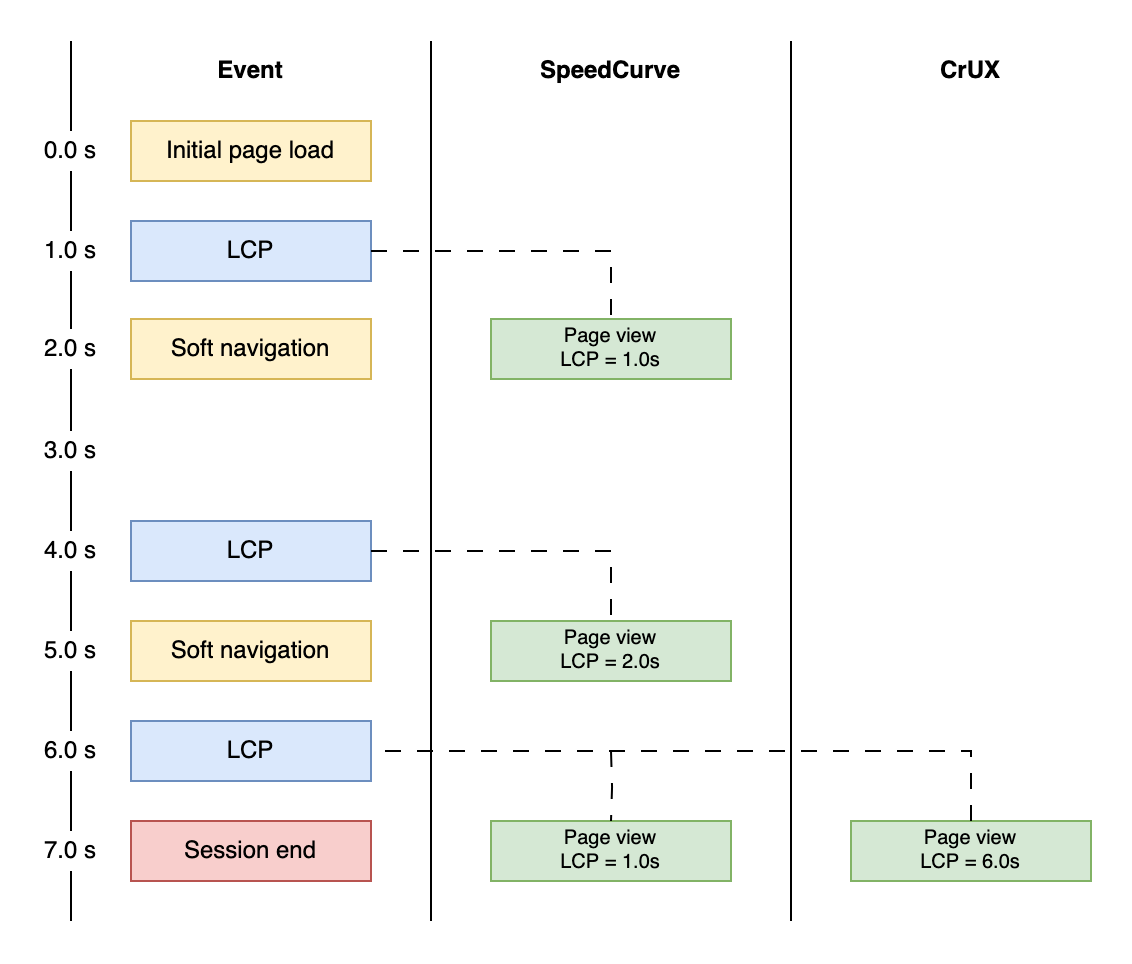
CrUX does not support single-page applications (SPAs)
CrUX is not currently aware of "soft navigations", i.e. page transitions within a single-page application. SpeedCurve tracks soft navigations as separate page views, each with their own metric values. For this reason, SPAs will have artificially high metric values in CrUX. See the illustration below for an example of how CrUX measures a SPA compared to SpeedCurve:
Data aggregation
Depending on where you are comparing the data from, you may be looking at different data aggregation methods. Google is standardizing on the 75th percentile for Core Web Vitals. Our charts default to the median (50th percentile) and we encourage users to look at the 75th when setting performance budgets. Here is a great summary of data aggregation in SpeedCurve if you want to understand more about percentiles.
Time periods
CrUX data available through Big Query is rolled up monthly (to the previous month). Page Speed Insights is based on the last 28 days. RUM time periods are configurable and may span as little as day up to the last 90 days.
Dimensions
There are a number of different dimensions provided by both CrUX and RUM. I won't list them all here (as they are likely to change and grow over time), but the thing to take into account is that you may be comparing substantially different cohorts.
CrUX does not segment by URL/path/page label*
When querying the public BigQuery data set, CrUX will segment a site by origin (i.e. https://www.speedcurve.com). RUM allows for further segmentation by page label, which provides a great deal of granularity, but may vary dramatically when compared to the entire set of urls from the origin.
*Note that the Page Speed Insights API does segment by URL.
Cumulative Layout Shift (CLS) scores may be different
While metrics collected are based on the same browser APIs or pattern (i.e. FID), CLS is a cumulative measurement that changes during the page lifecycle. For RUM, the calculation of CLS stops when the beacon is fired. However, for CrUX the measurement continues until the visibility state changes to "hidden". This may lead to very different CLS numbers reported, especially if your application continues to see layout shift occur after the load event.
Summary & recommendations
CrUX and RUM are a solid representation of reality. We love CrUX and the awesome data it provides site owners who are interested in improving UX. We are also very supportive of Google providing guidelines around metrics such as Core Web Vitals and encourage you to take those into consideration when setting performance budgets.
If you see numbers with a large amount of variance: Make sure you are segmenting your RUM data appropriately using the dimensions and data aggregation available to you.
If you see numbers that vary slightly: Don't worry about it. Focus on improving the UX and the number over time, just as you would with Lighthouse scoring or other metrics that may not "match" in other areas such as synthetic.
Updated about 1 year ago