Budgets dashboard
Your Budgets dashboard lets you monitor and manage all your Synthetic and RUM performance budgets in one place
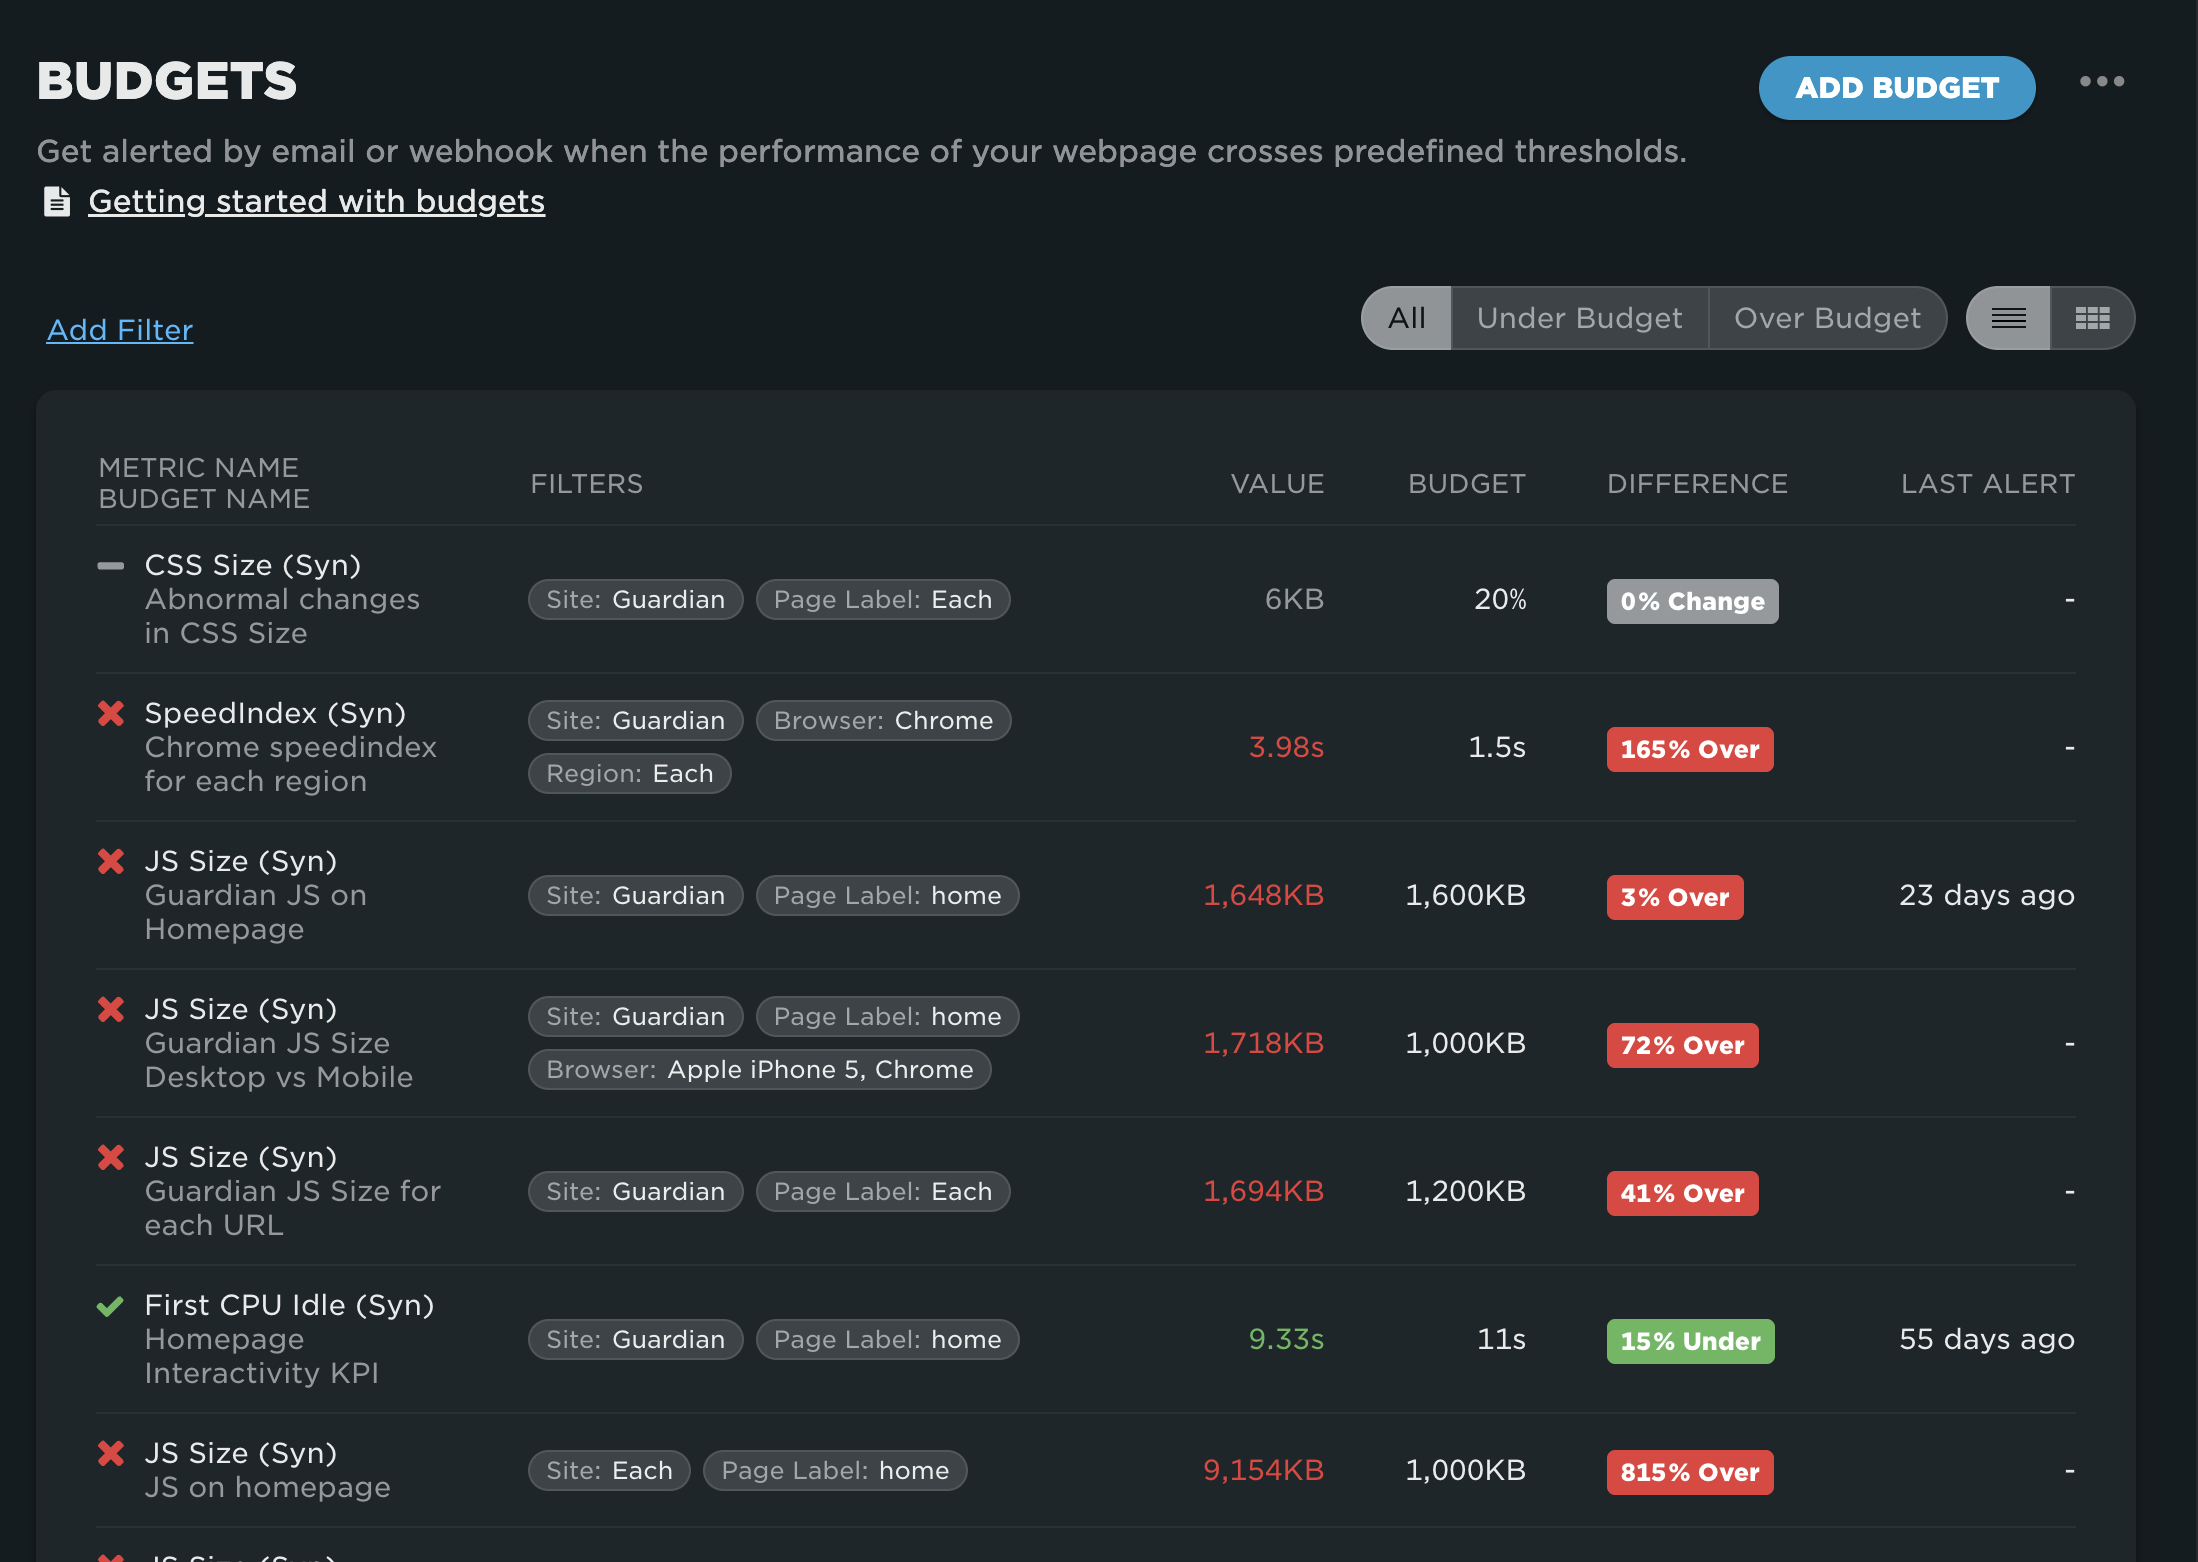
The Budgets Dashboard provides a centralized location to view, manage, and monitor all your performance budgets. You'll see the current status of every performance budget, and you can click on any individual budget to explore its recent performance and any associated alerts in detail.
Navigating and filtering budgets
For larger teams with many performance budgets, effective navigation and filtering are essential. The Budgets Dashboard offers powerful tools to help you stay organized:
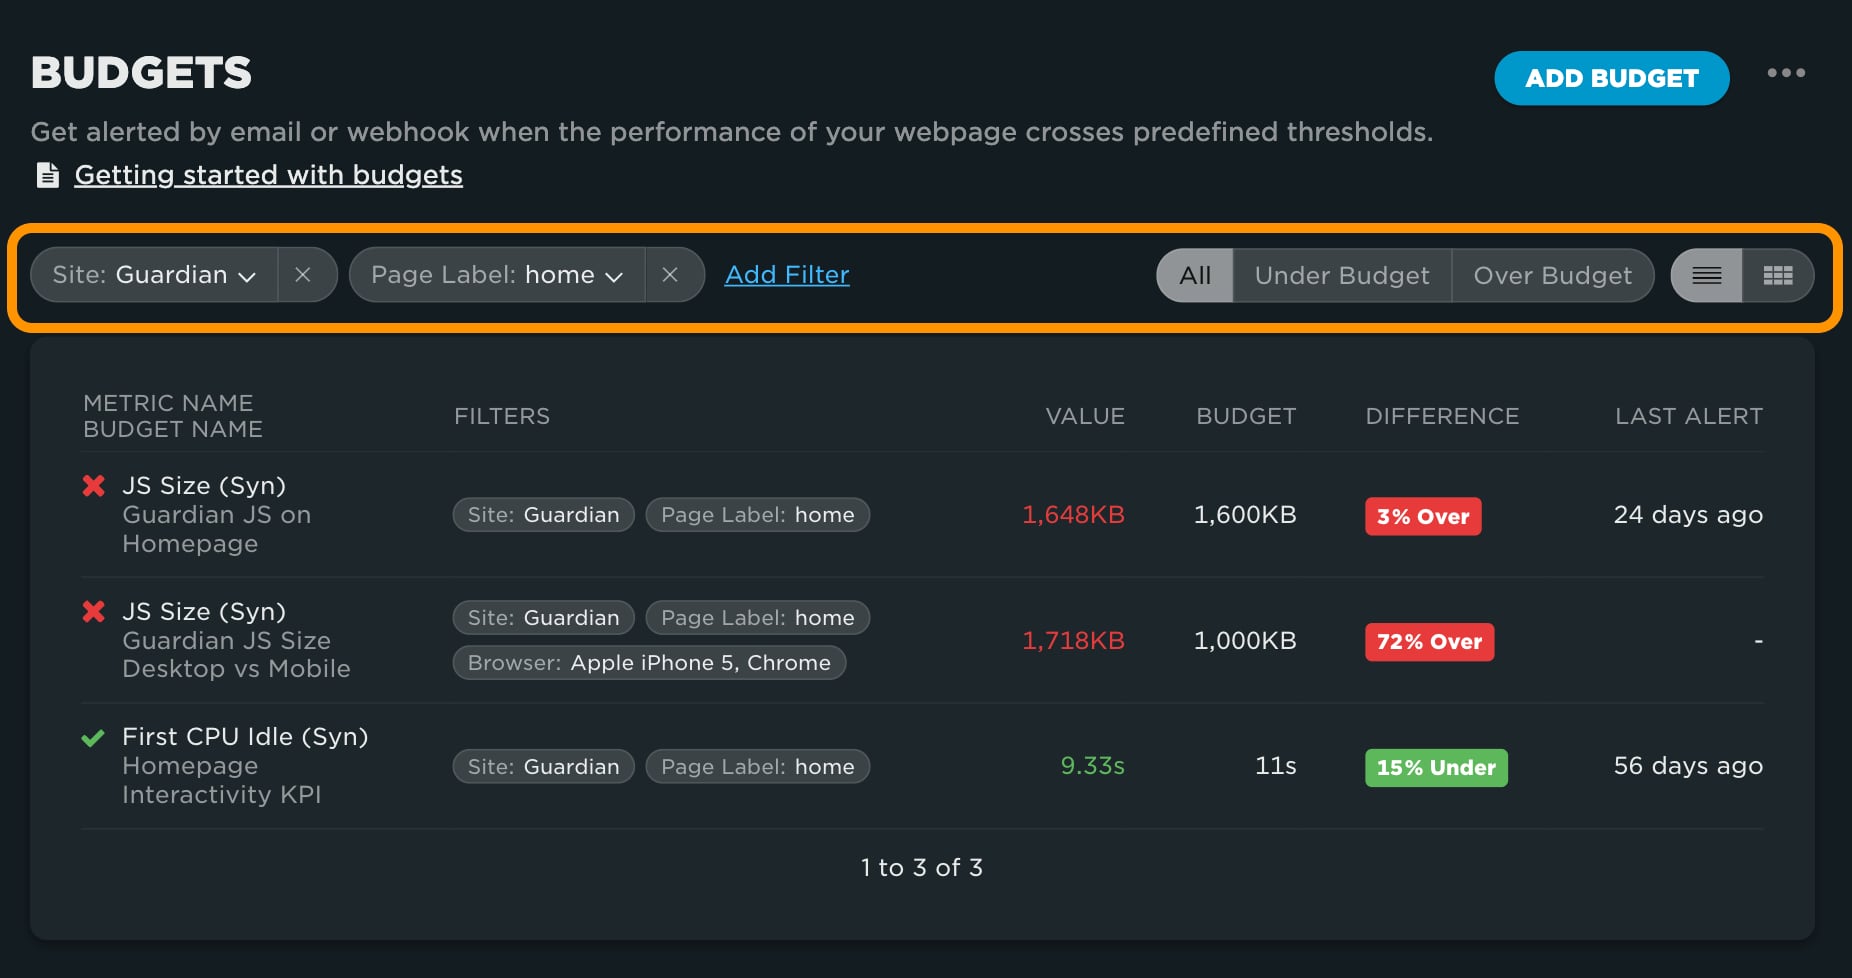
- At the top left, you'll find the filter panel, where you can apply filters to quickly locate specific budgets.
- At the top right, the budget status filter lets you easily switch between viewing all budgets, only those under budget, or only those over budget.
- Also at the top right is the budget view toggle, allowing you to switch between the default list view and a more visual card view.
Adding a budget
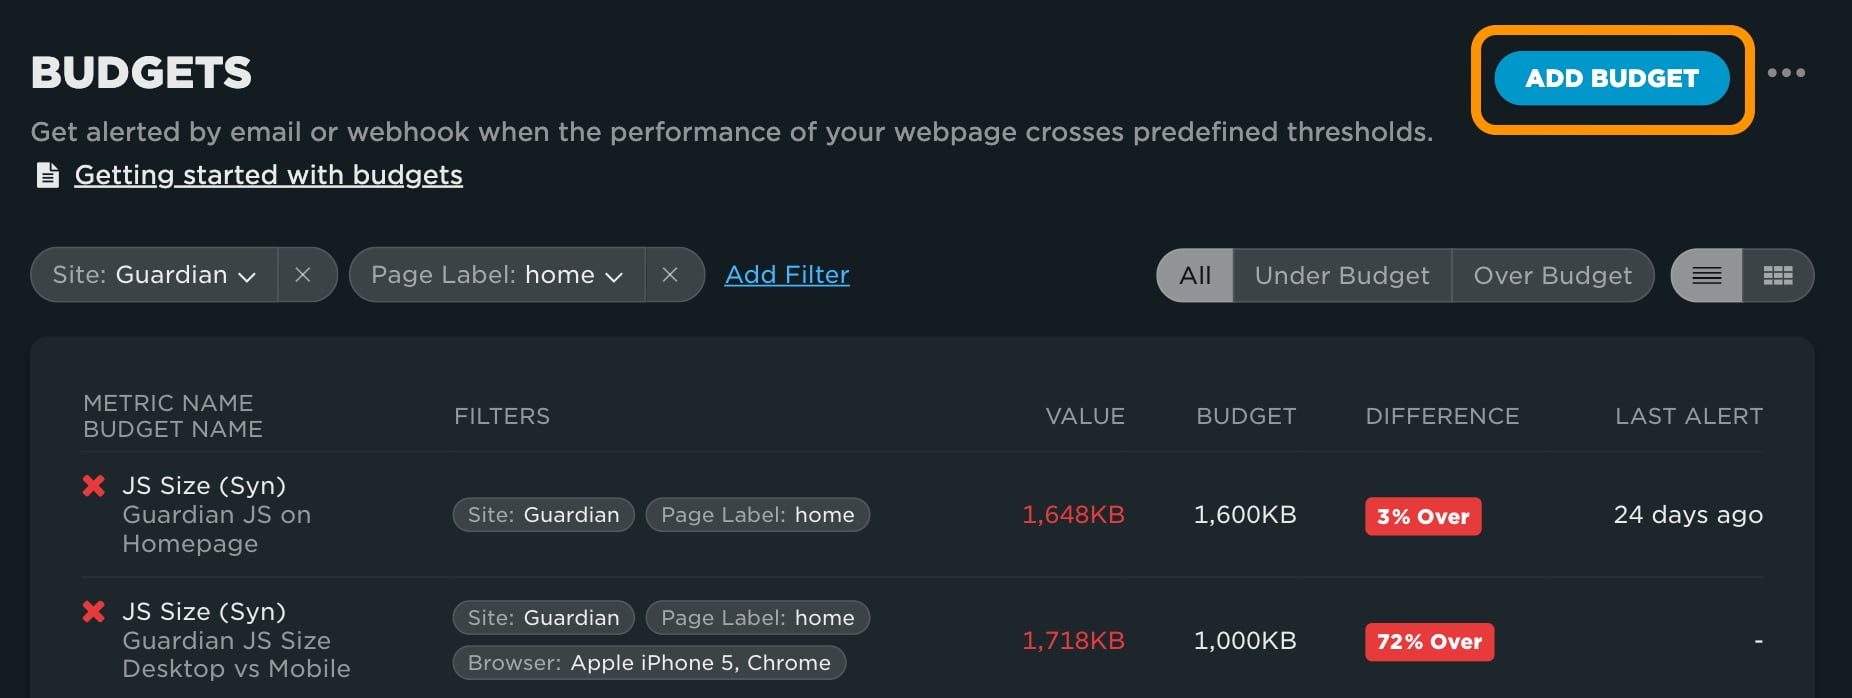
To create a new performance budget, click the Add Budget button at the top right of the Budgets page. This will take you to the Add Budget screen, where you can define your new budget. For step-by-step instructions, follow our guide to creating a performance budget.
Budget detail dashboard
Each budget has a detailed dashboard showing an overview of the settings, current status, recent performance, alerts, and audit history. Here's a closer look at each section:
Overview
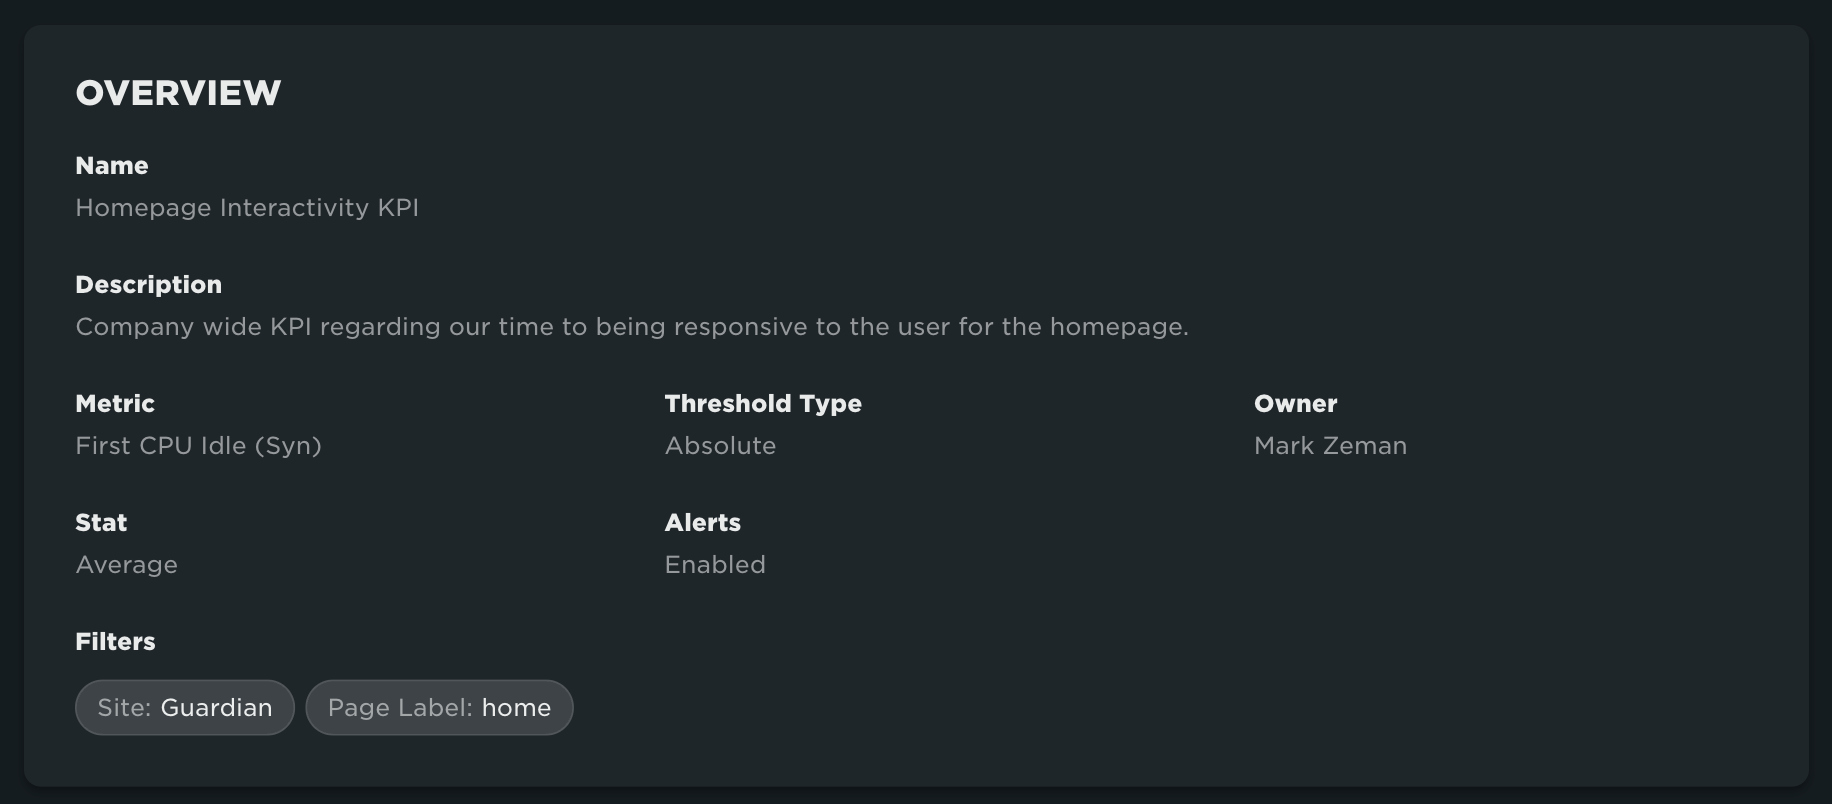
The dashboard begins with a clear overview of the budget’s configuration. You’ll see:
- The budget's name and description (helpful for collaboration)
- The metric being monitored
- The threshold type
- Any applied filters
- Whether alerts are enabled
Current Status
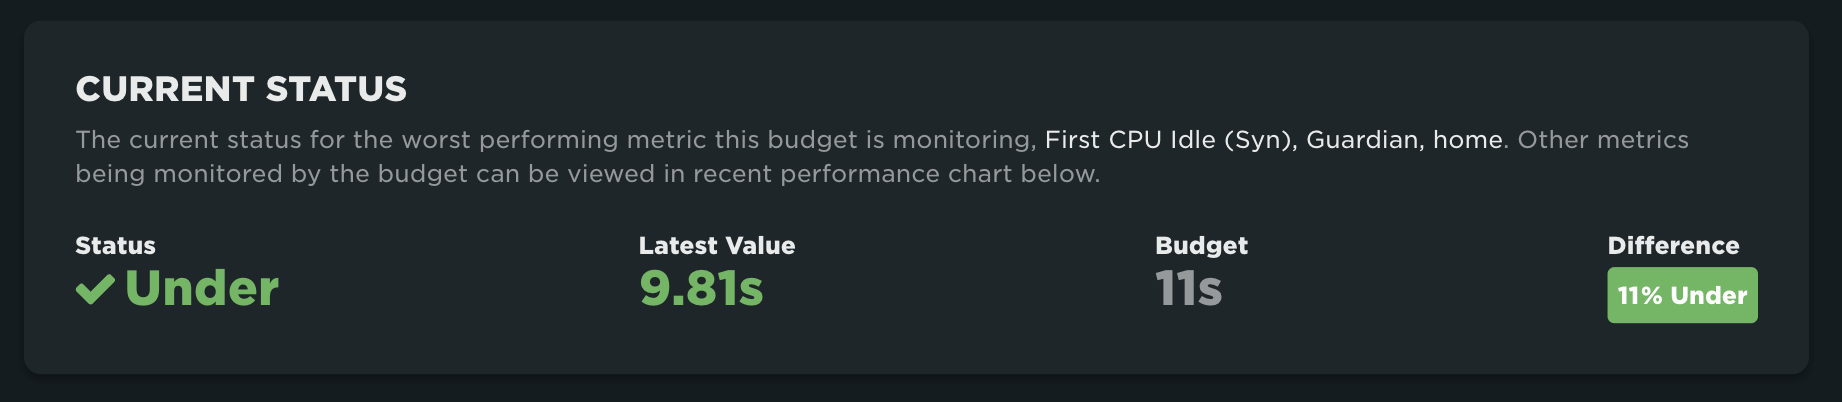
The current status of the budget. This section tells you if the budget is under, over or in a no crossing status. You'll also see the latest value for the metric, along with the threshold for the budget and the difference between the two values. If more than one metric is being monitored by the budget, this panel will show you the status of the worst performing metric being monitored.
This section shows the current status of the budget—whether it's under, over, or in a no crossing state. You'll also see:
- The latest value of the monitored metric
- The set threshold (Budget)
- The difference between the two
If the budget tracks multiple metrics, this panel reflects the status of the worst-performing one.
Recent Performance
This chart visualizes the budget's recent performance and makes it easy to spot when thresholds were crossed. Clicking on a data point will take you to either the Test Dashboard (for synthetic metrics) or the Sessions Dashboard (for RUM metrics), both of which offer deeper performance insights for troubleshooting.
If alerts are enabled, the chart will also show markers indicating when alerts were triggered. For budgets using a rate of change threshold and tracking multiple metrics, only one metric is shown at a time by default (to reduce visual noise). You can toggle between metrics using the chart legend.
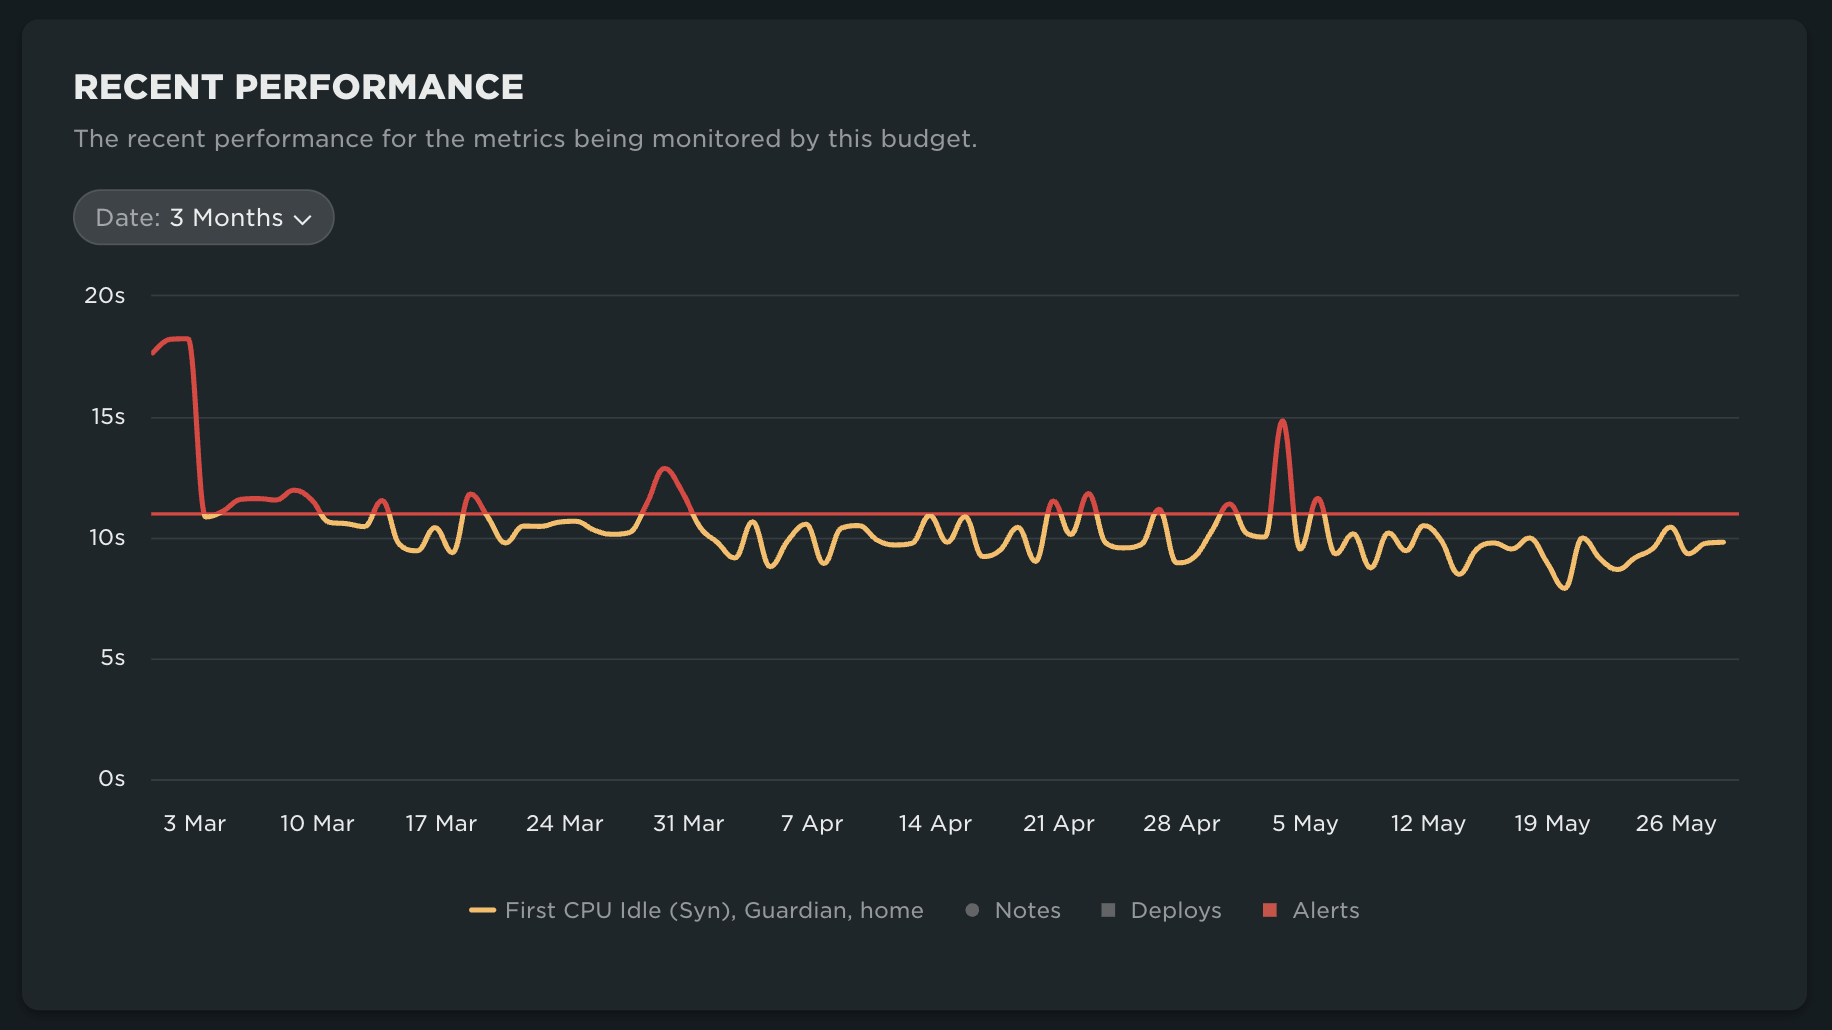
Recent performance for a budget with an absolute threshold
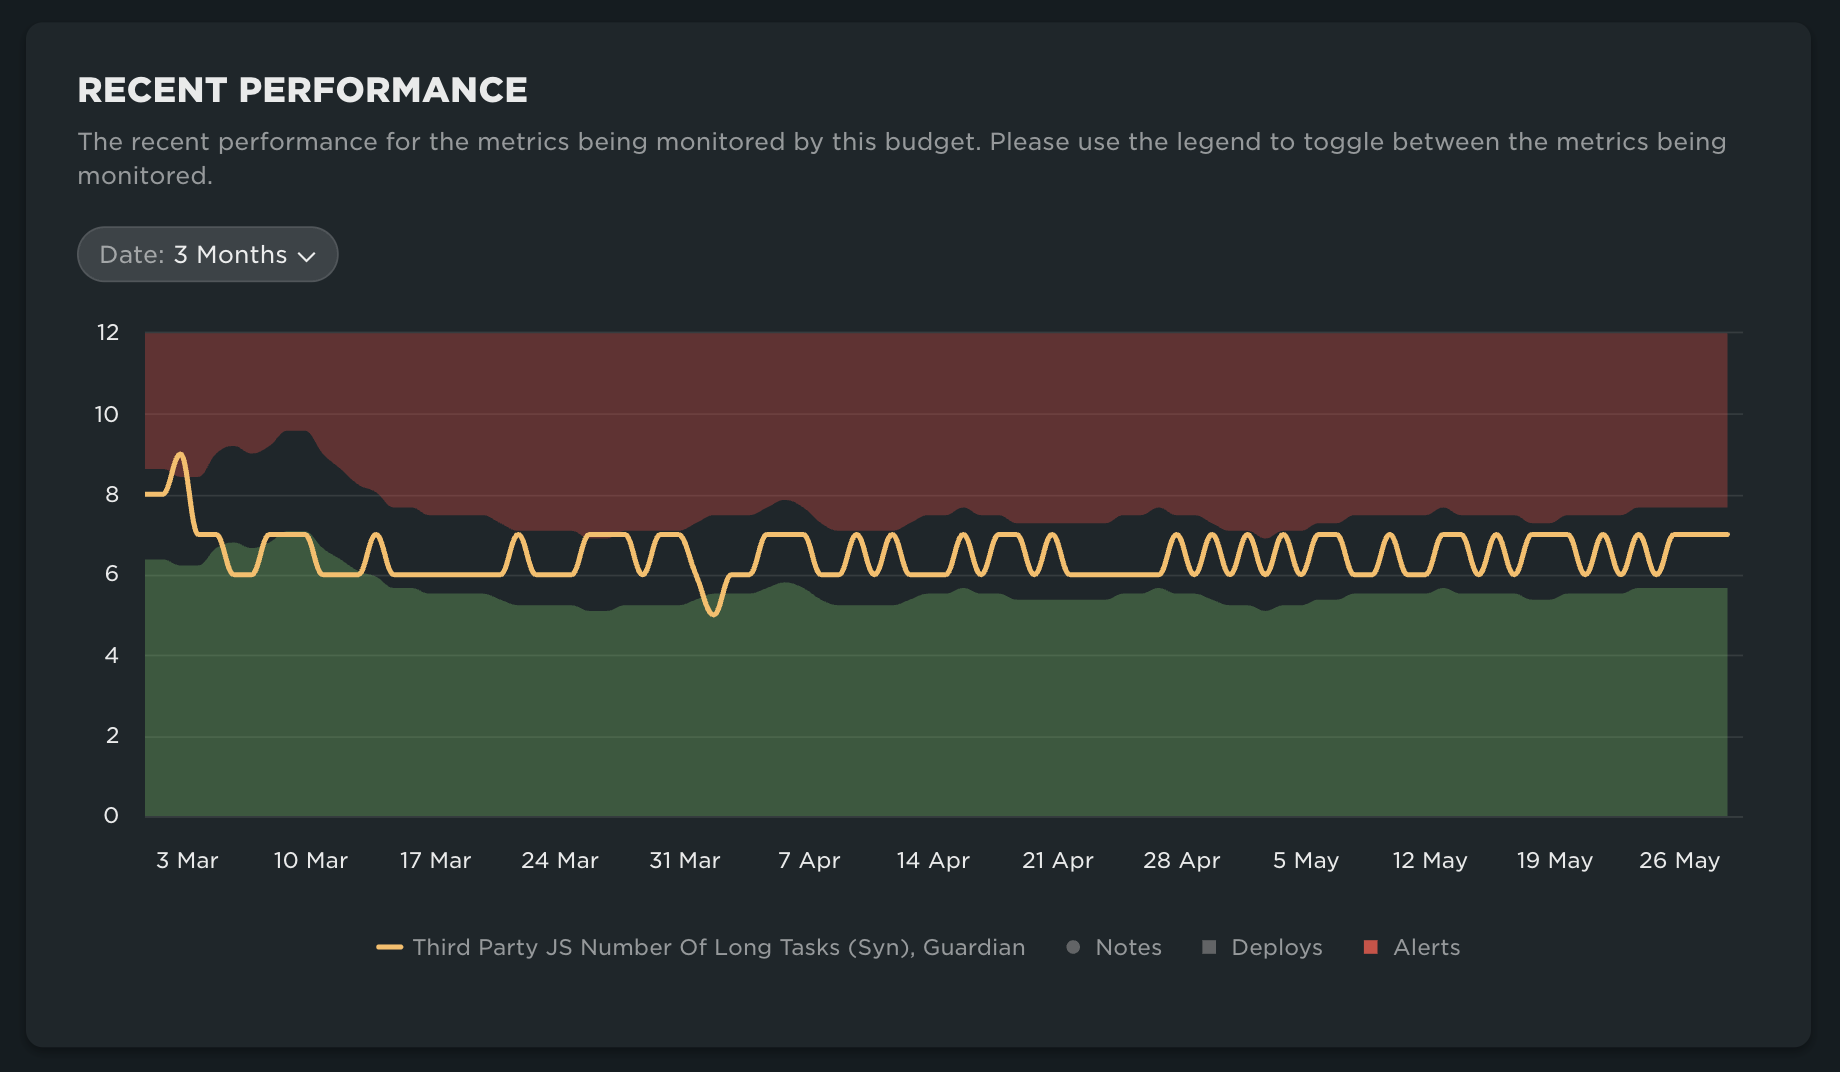
Recent performance for a budget with a rate of change threshold
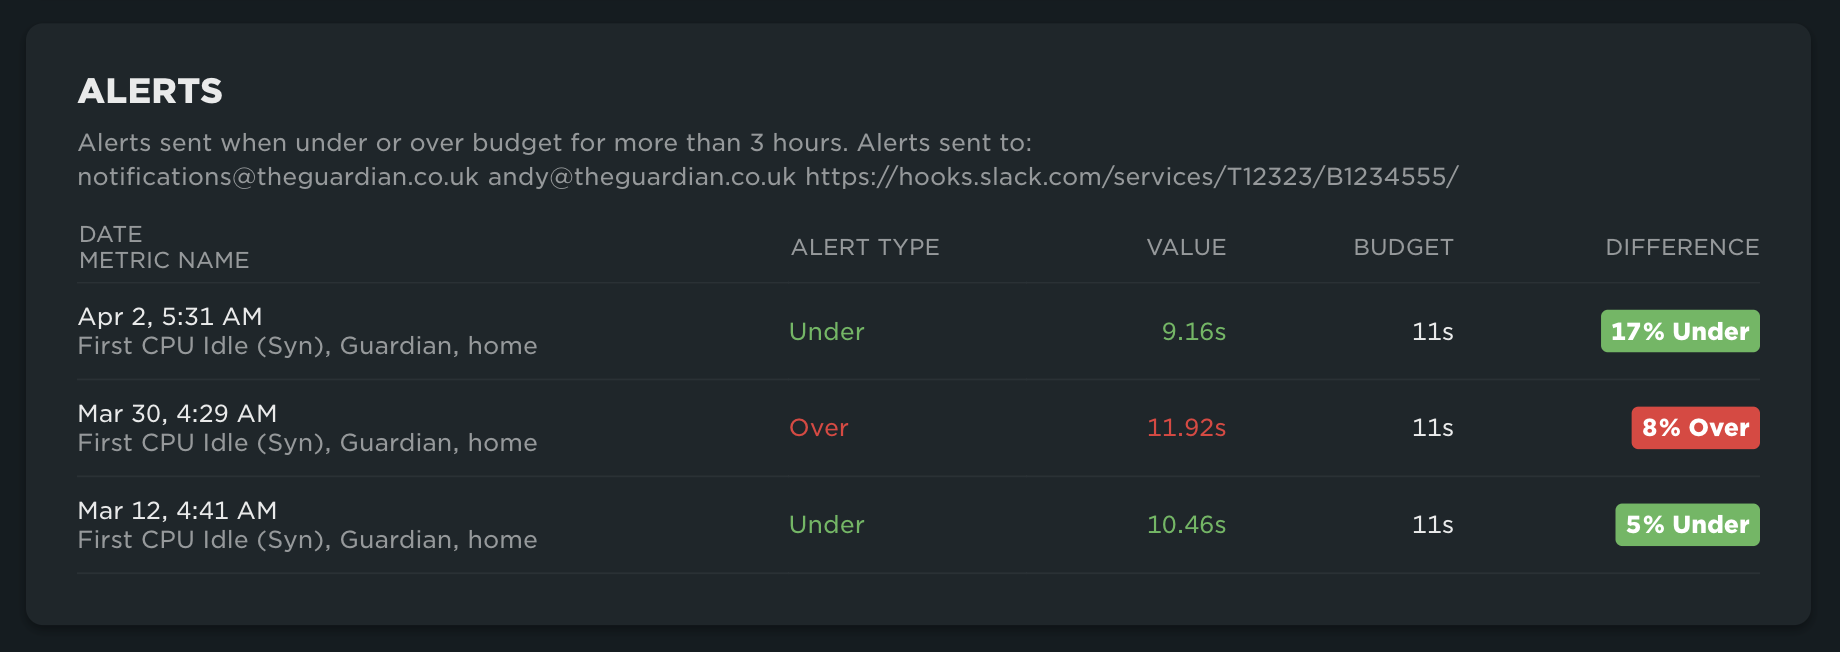
Alerts
When alerting is enabled, this section shows a detailed alert history. You'll see:
- The exact time alerts were sent
- The budget status at the time
- The current list of email recipients and webhooks receiving alerts
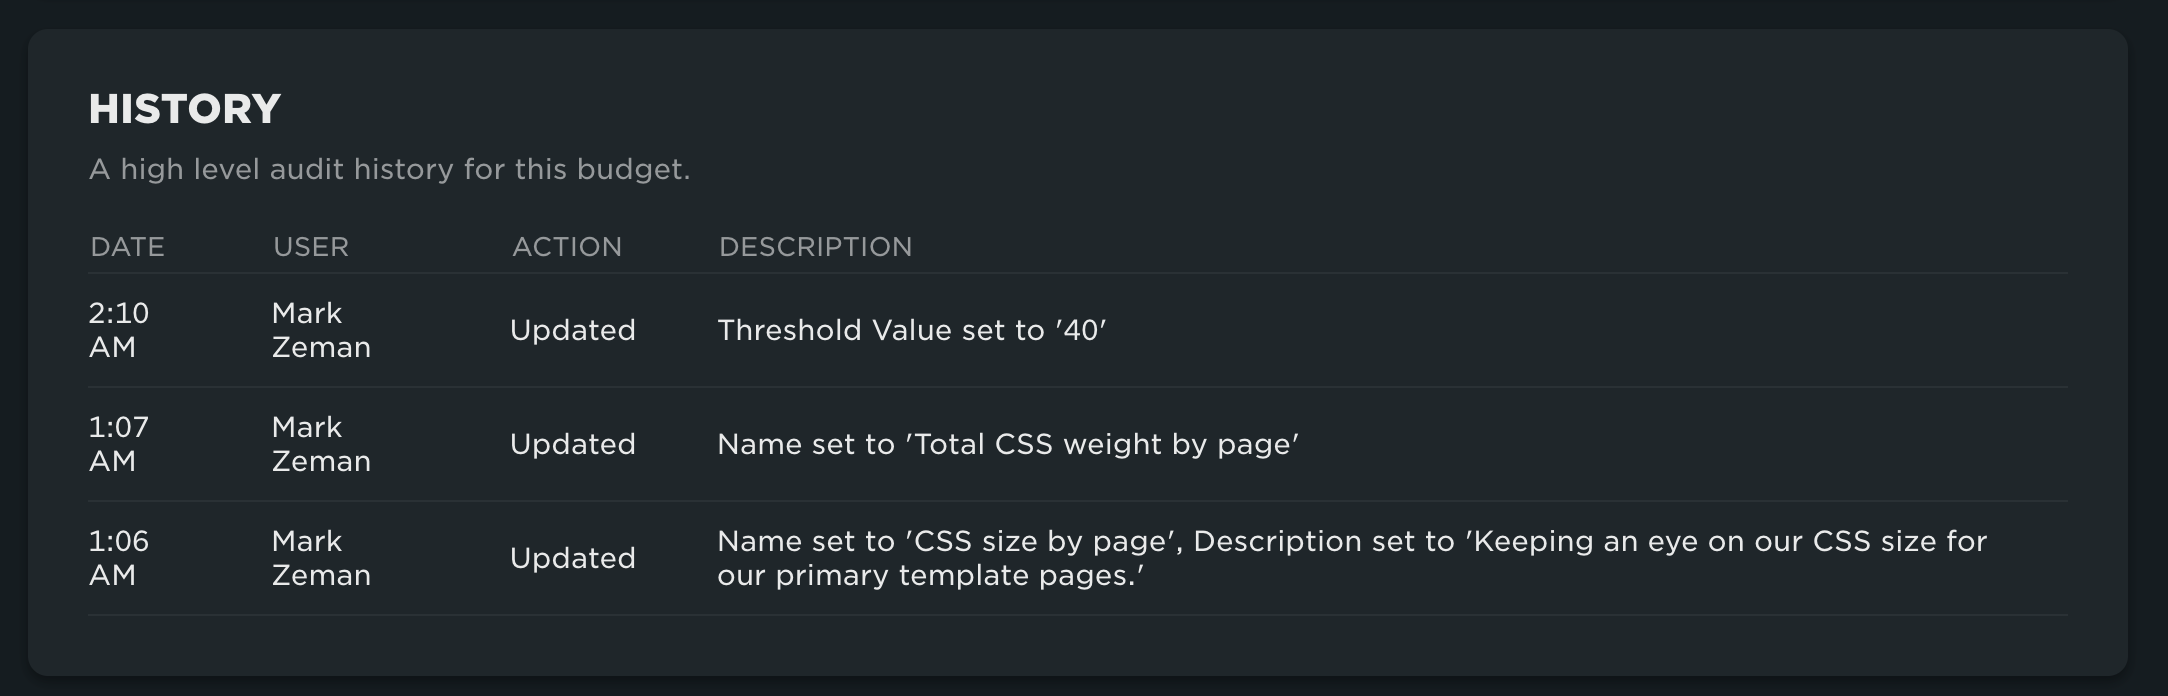
History
The final section is the audit history, which logs who made changes to the budget and what was modified. This promotes transparency and collaboration within your team.
Updated about 1 year ago