First & third party tracking
How to monitor individual first & third party request groups over time – and set performance budgets and alerts for them.
In your Synthetic First & Third Party dashboard, we automatically group all third party requests in your third party waterfall chart. This lets you easily identify all the third party services used on your website as well as any request groups you've created (later).
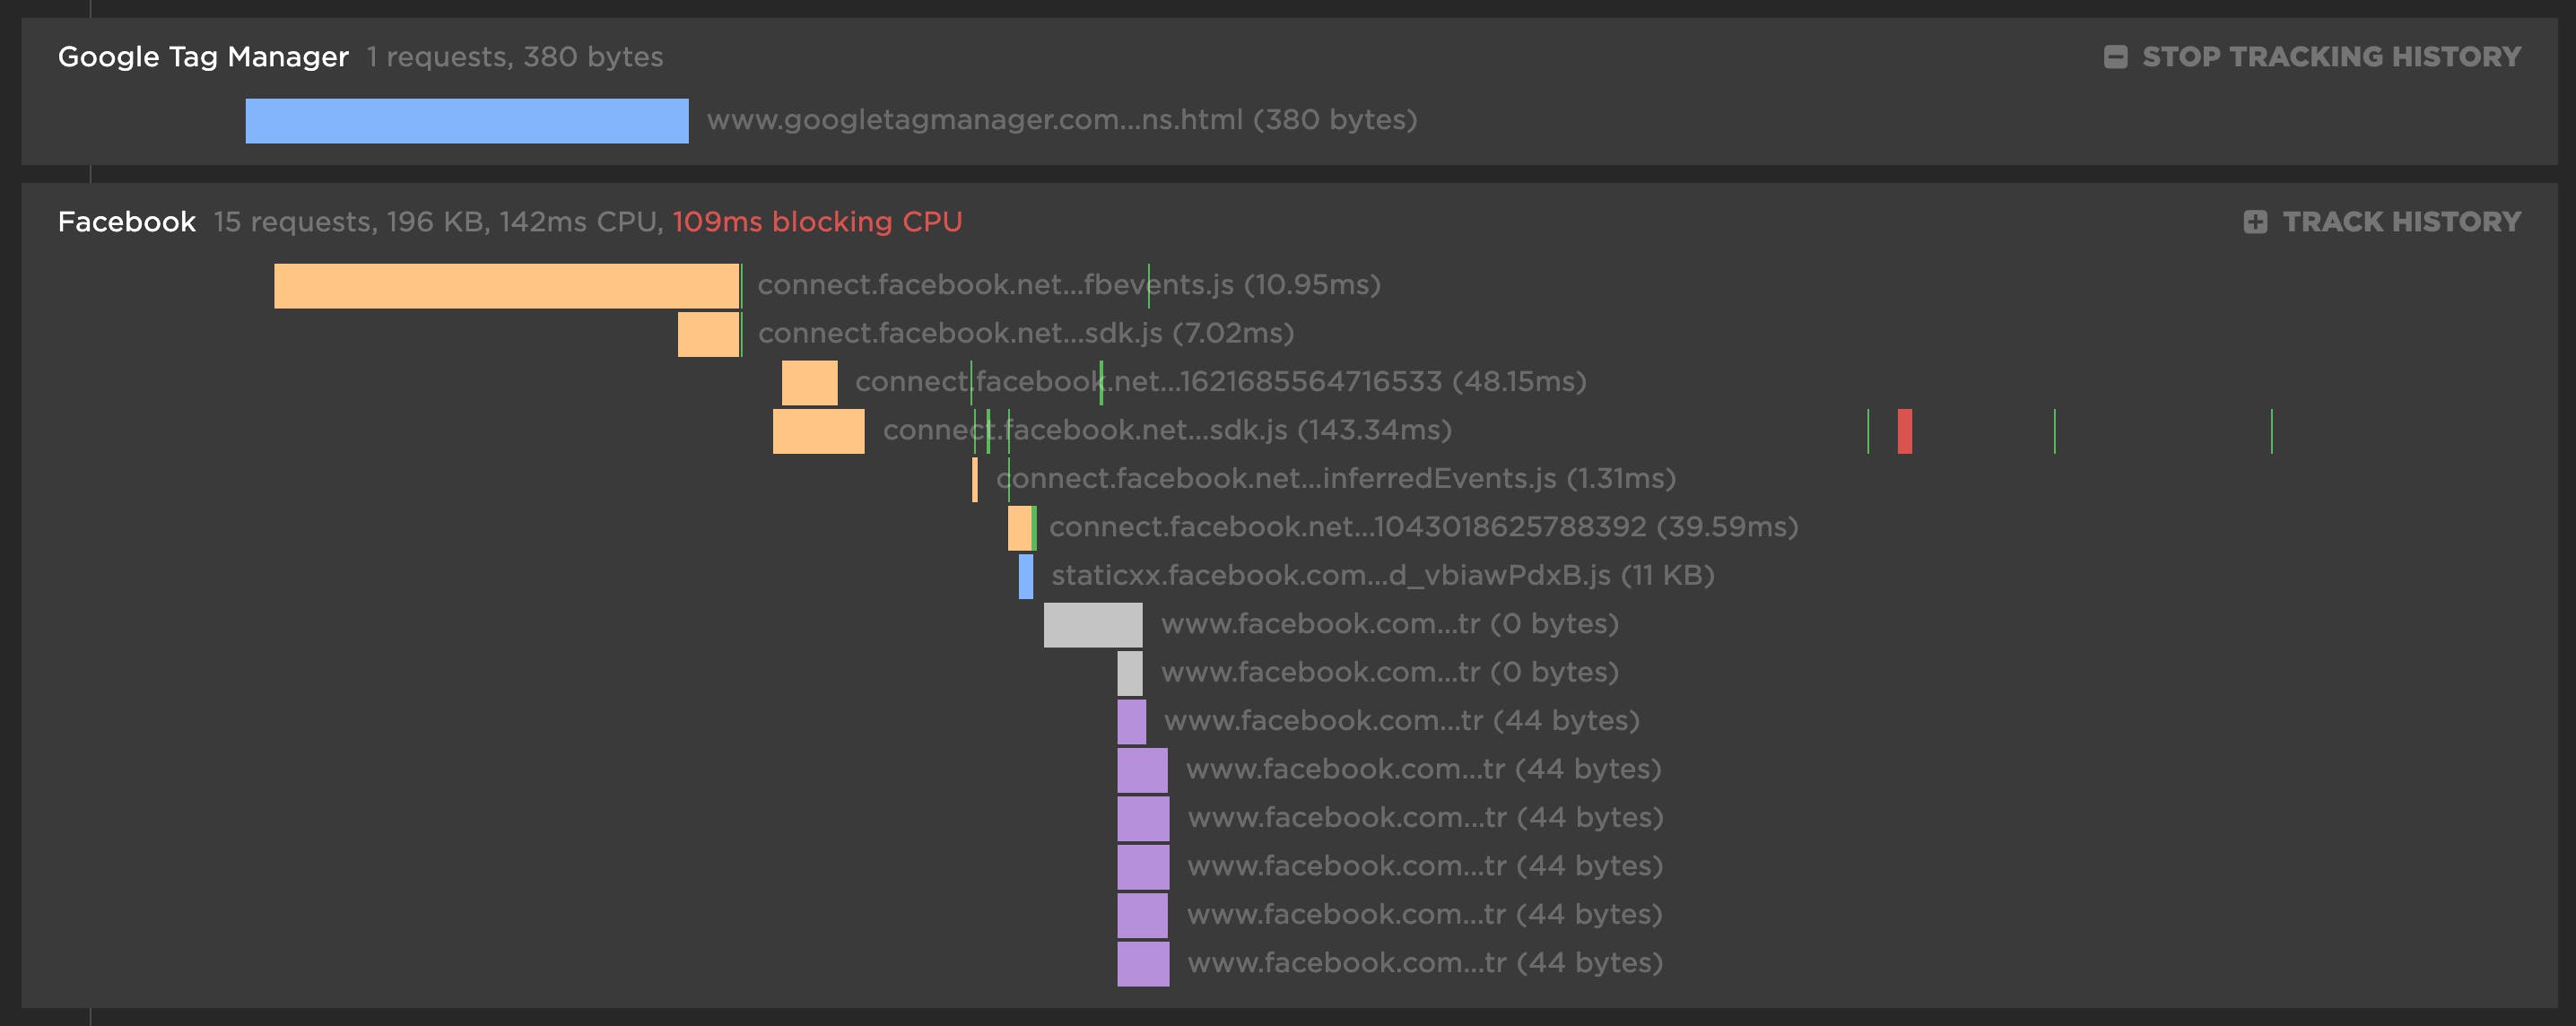
For each third party or customer request group, you get the number of requests and size for each content type.
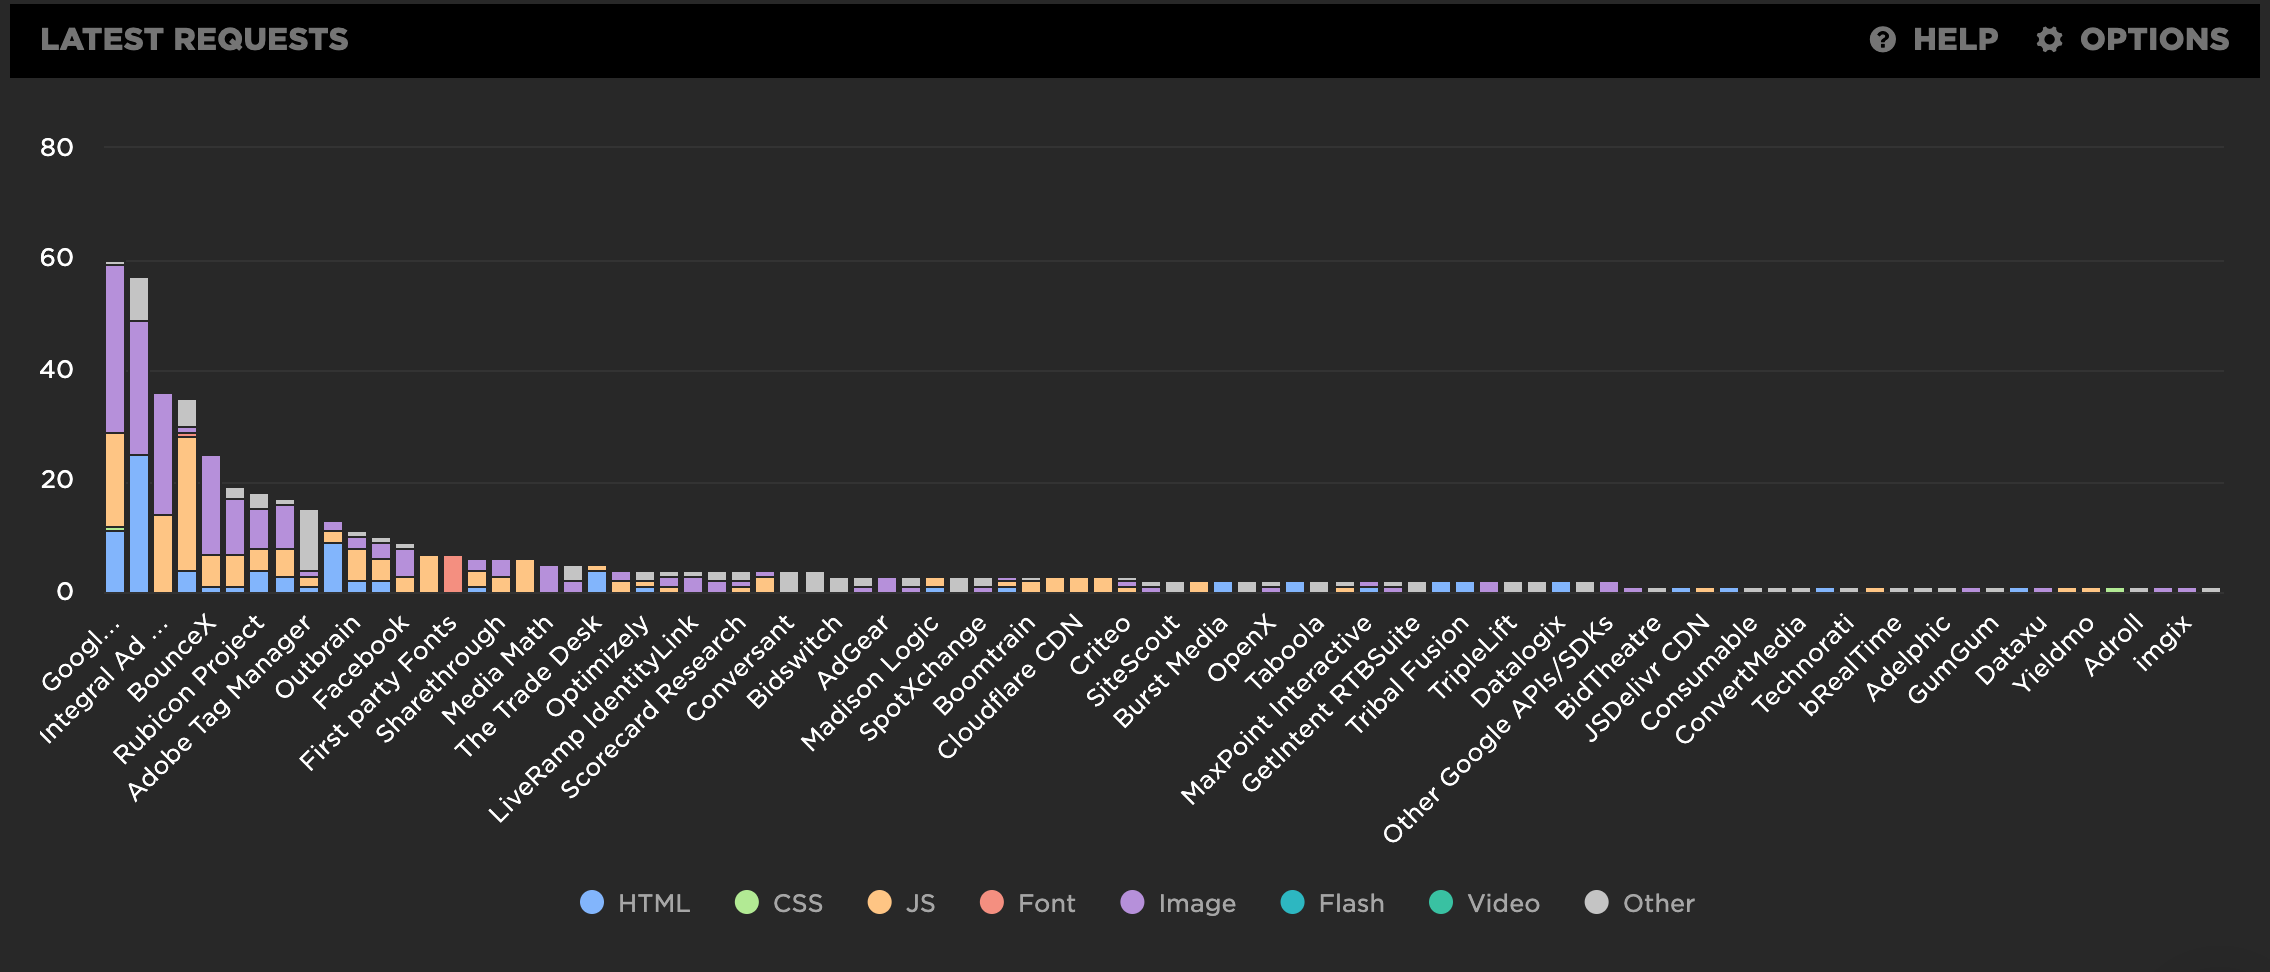
Requests classified by 3rd-Party
Tracking the number or size of requests isn't enough
We don't believe that the number of requests or the size of requests a third or first party makes is a good enough indicator that they are a bad actor. A well-built web page that manages its requests can easily negate any issues by delaying those request till after the page is rendered and interactive.
What really matters is how a requests might be blocking the rendering or the interactivity of the page.
These blocking metrics are a far better indicator of who might be causing real issues on your page:
-
Blocking JS or CSS requests. This tells you if the rendering of the page is being delayed by a blocking request from a third party or custom request group.
-
Blocking CPU caused by a third party or custom request group. Blocking CPU is any JS function that takes longer than 50ms (also known as a long task), which often leads to page jank. Blocking CPU stops your users from smoothly interacting with your page and delays other metrics like First CPU Idle and Time To Interactive.
In this example, Vidible has 594ms of blocking CPU, causing jank on the page, while all the other third parties don't trigger any signifiant CPU activity at all. This helps you quickly focus in on which third parties are causing real user experience problems.
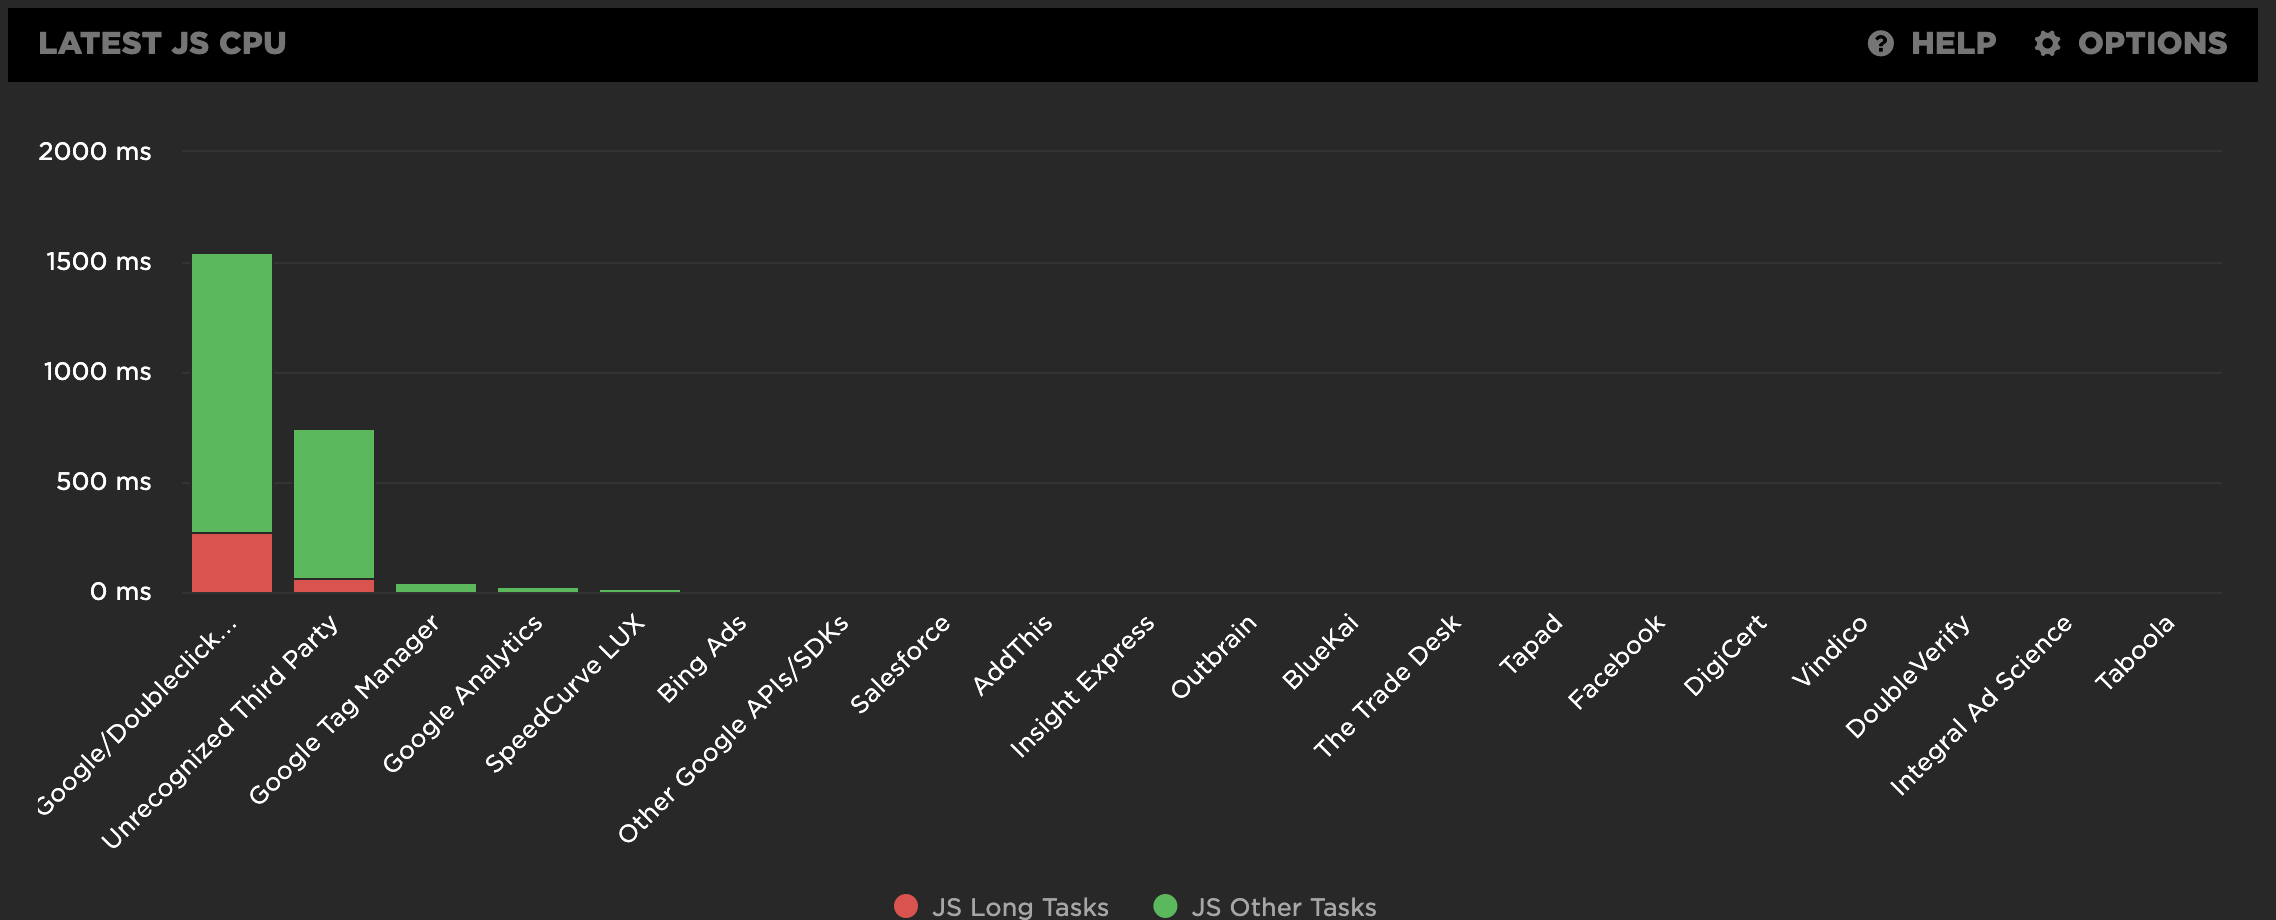
Script CPU usage by 3rd-Party
1. Review your First & Third Party Synthetic dashboard
When you review your dashboard, you'll want to double check that resources have been grouped correctly.
First Party
We use the URL you're testing to identify the first party domain and any sub domains. So if you're testing "website.com" we'll also include any subdomains like "cdn.website.com" as a first party.
All other requests will either be identified as a known third party service or will be lumped together into the "Unrecognized Third Party" group. There's a good chance there might be other domains in that group that you consider first party. You can move resources into the first party group by adding them to Settings > First Party.
Unrecognized Third Party
We use the open source project third-party-web to identify known third party services. If there are other popular third party services that you think should be recognized but aren't, you can let SpeedCurve support know ([email protected]) or contribute them directly to the project.
Custom Request Group
In Settings> Request Groups you can also build your own custom third party with a set of filters that match on the URL or your resources.
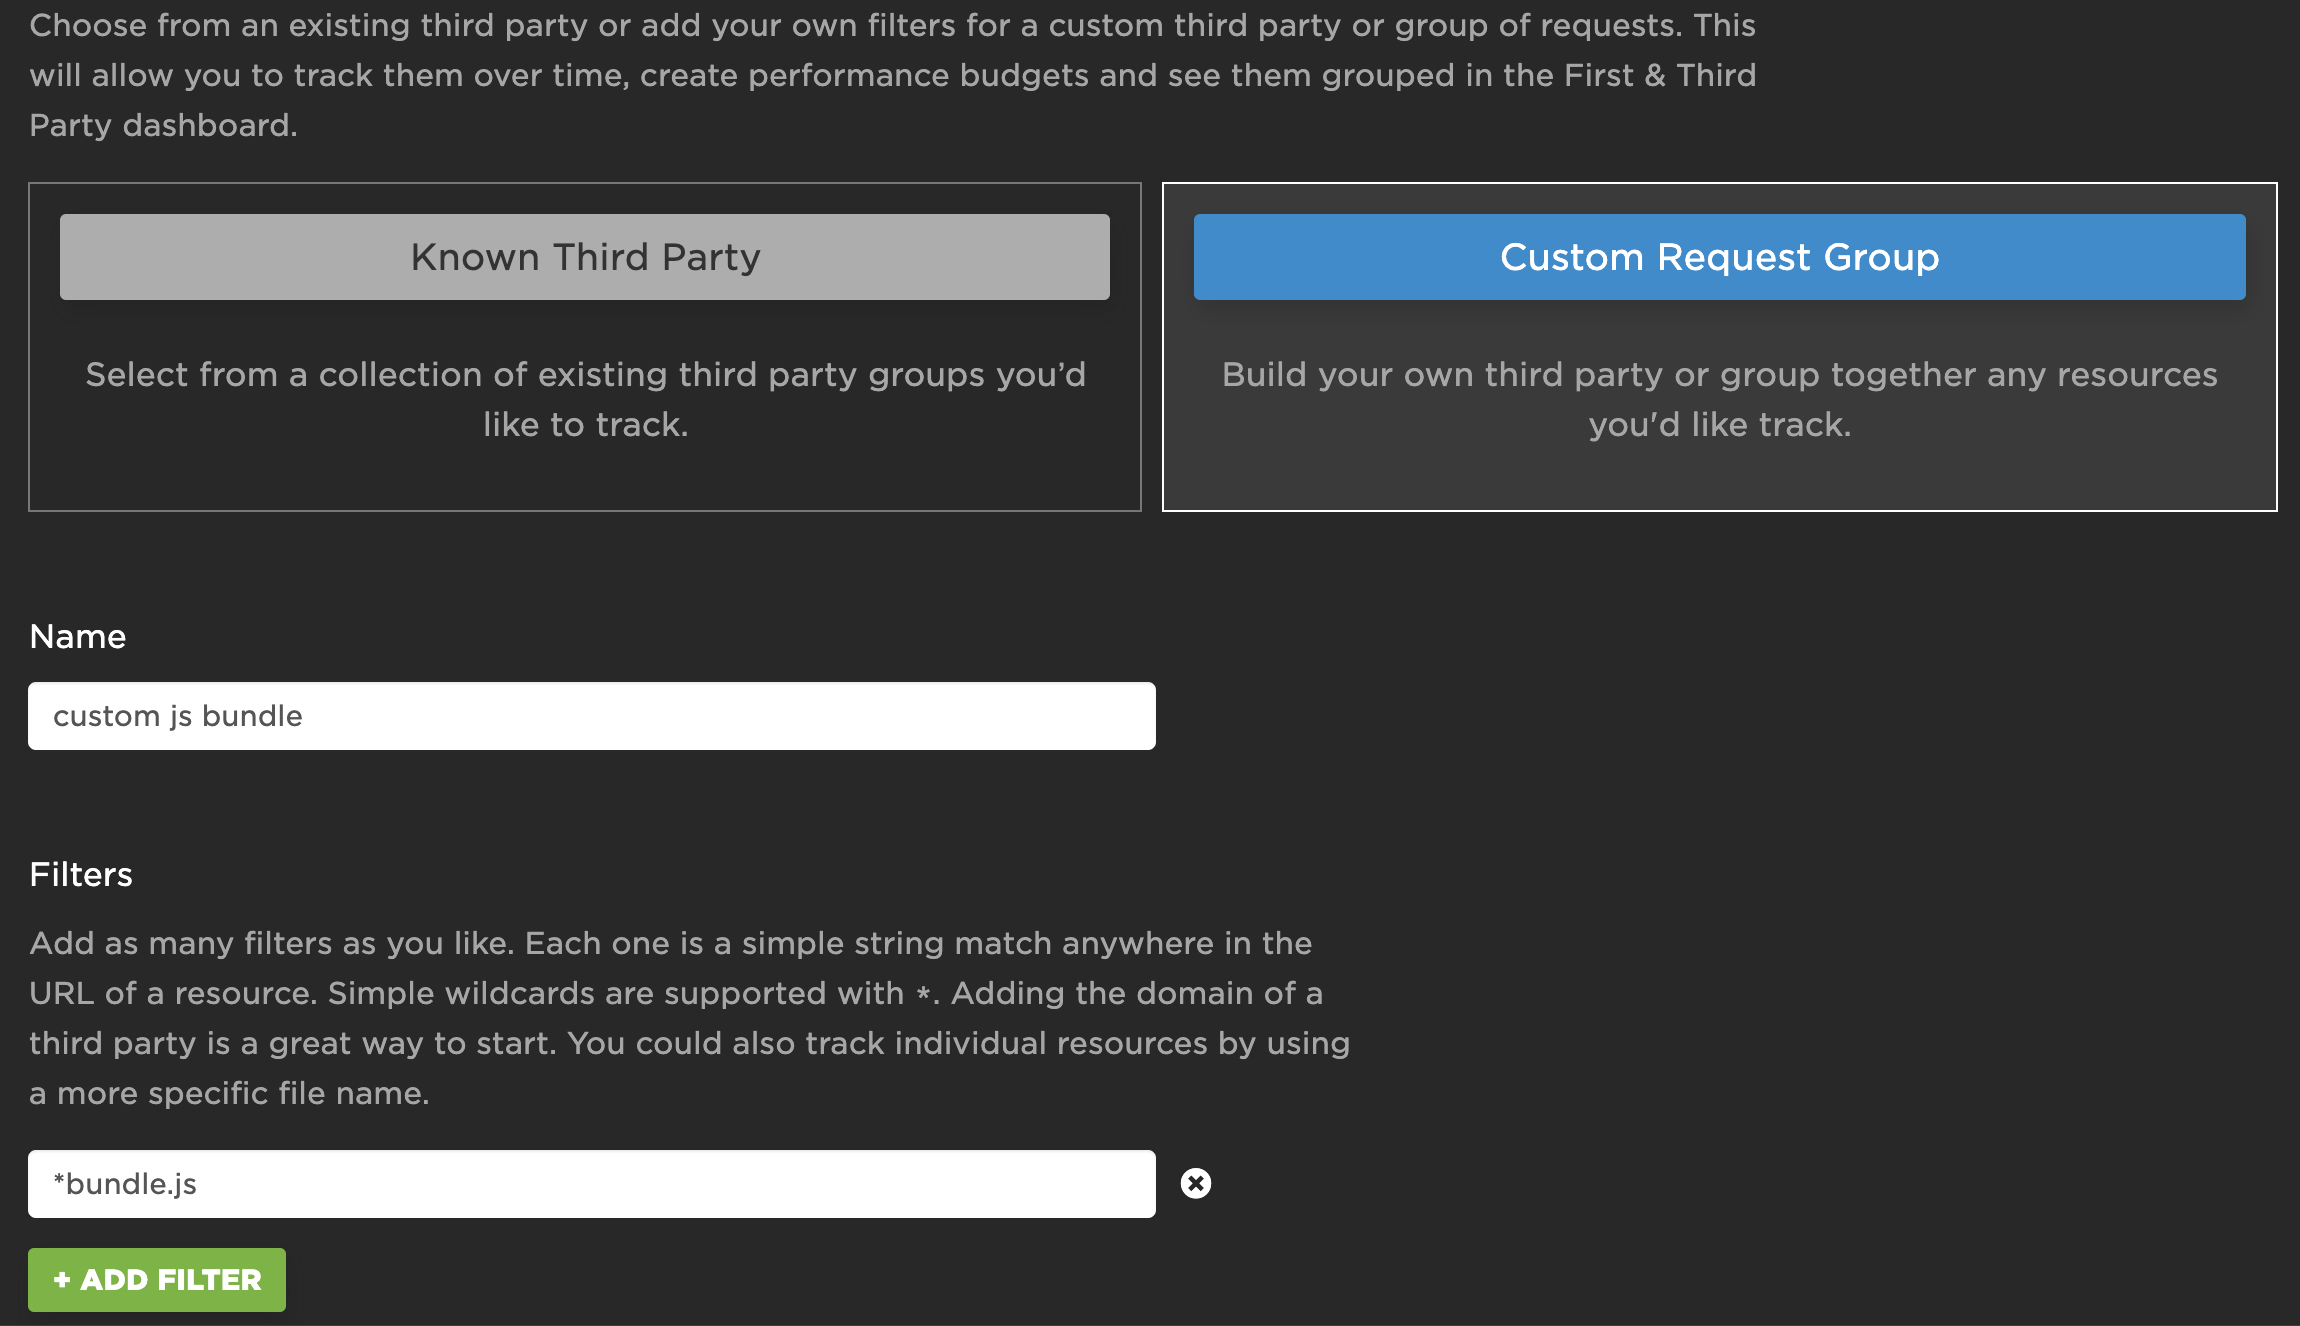
Creating a Custom Request Group
A custom request group is actually just a group of resources and doesn't have to be strictly used for tracking a third party. You can even track the history and set performance budget and get alerts for a single request. If your task is to trim down a specific JS request and make sure its size or CPU usage is within budget, then you can setup a specific filter, set a performance budget, and monitor your improvements.
Custom request group filters support basic wildcard matching with an asterisk (*). Multiple wildcards are allowed, for example https://assets.speedcurve.com/*/*.js
2. Turn on "Track History"
For any third party in your waterfall, you can turn on "Track History" and we'll start collecting detailed third party metrics every time we run a test. You can then monitor a third party over time and set performance budgets and alerts.
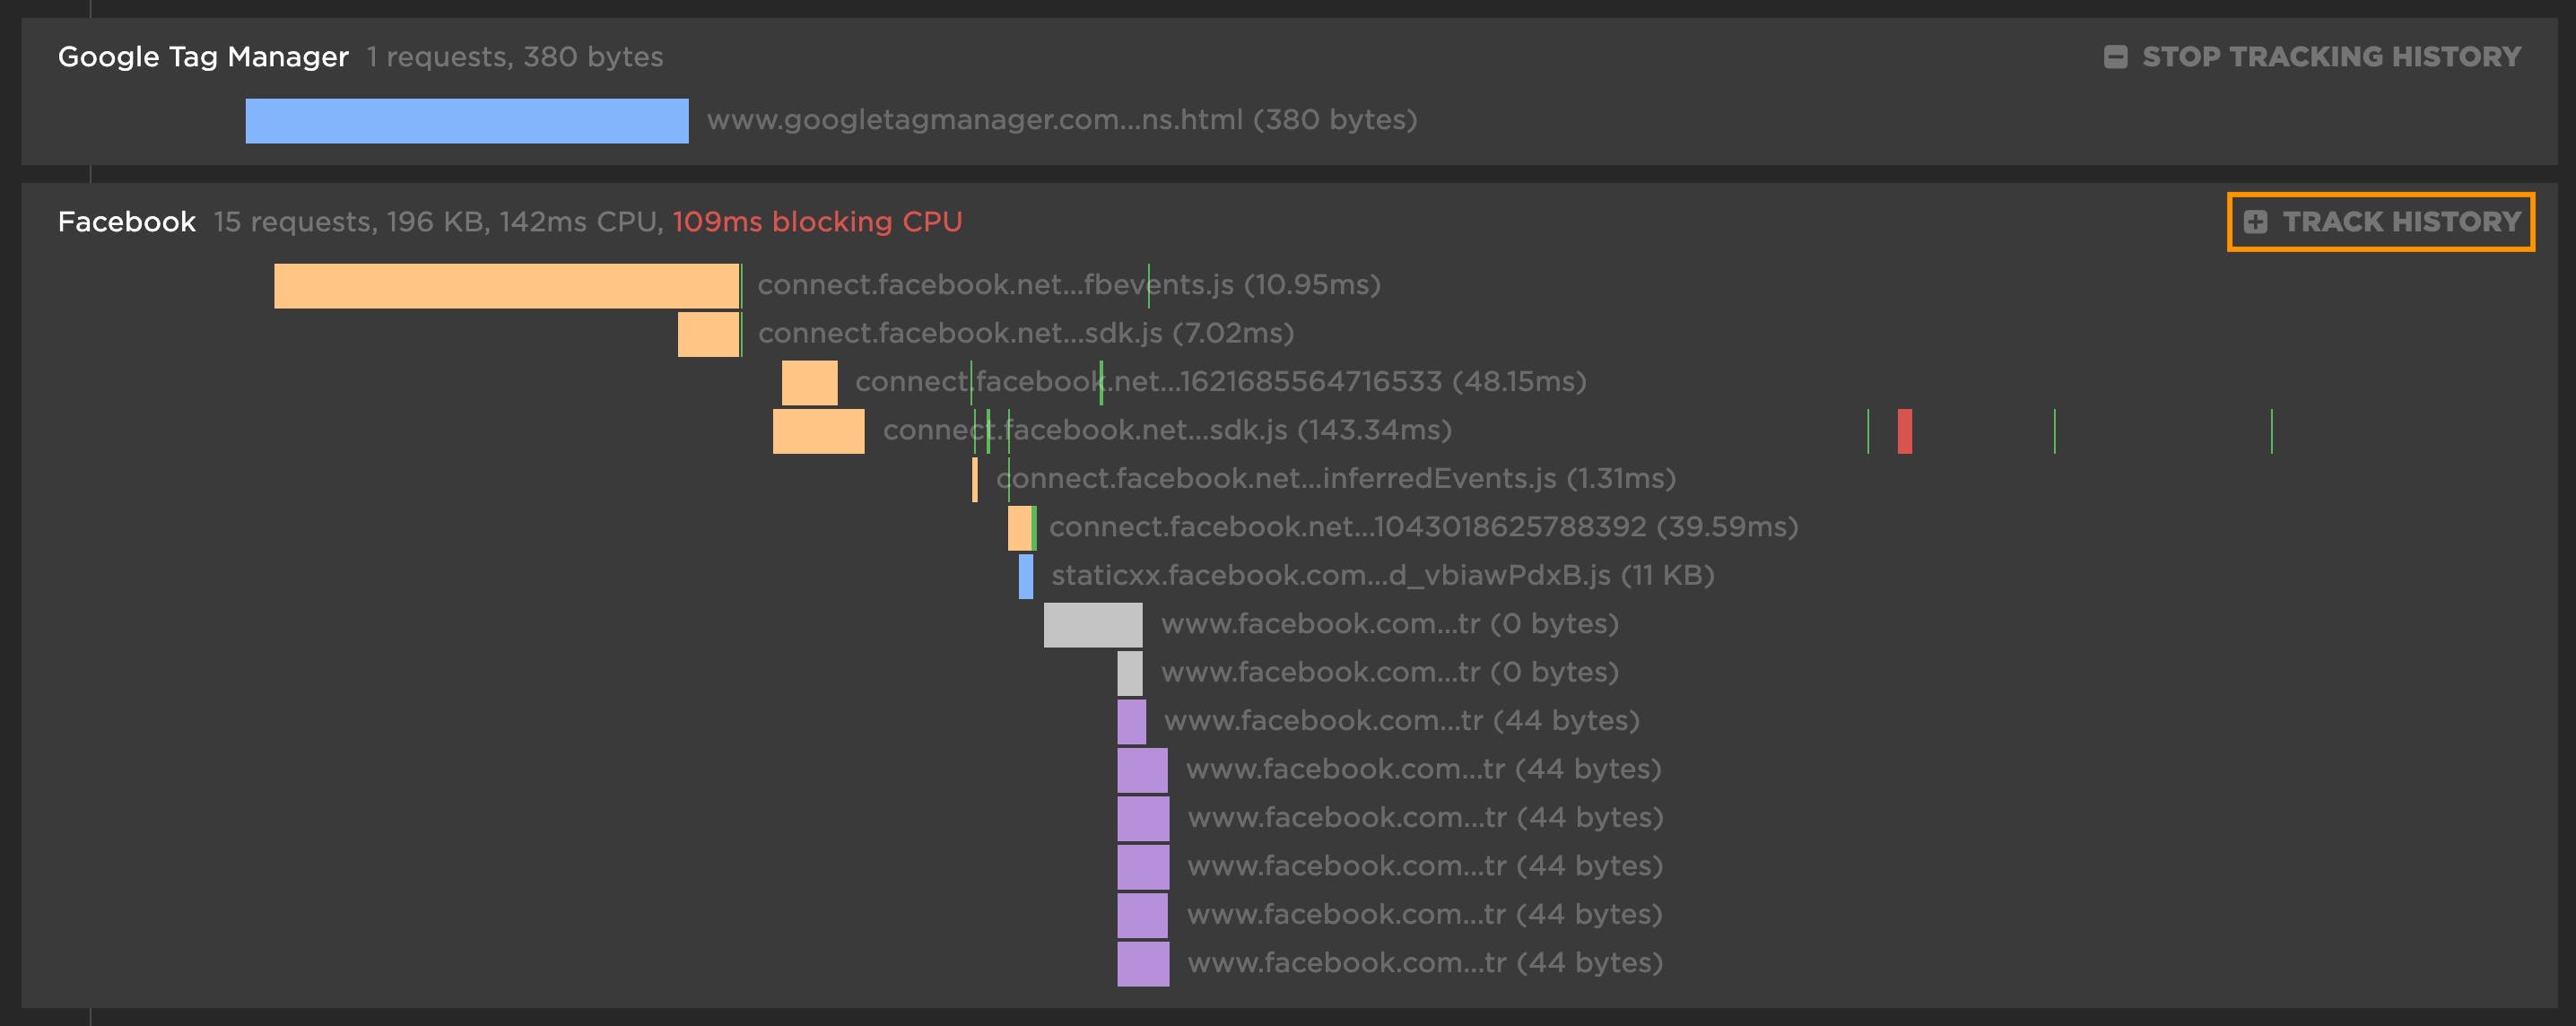
Tracking the history of a request group
This is a great way to keep an eye on any changes a third party might be making and alert you to impacts on your page. You could even agree to an SLA with a third party and then use SpeedCurve to monitor and enforce it, keeping everyone honest and on the same page.
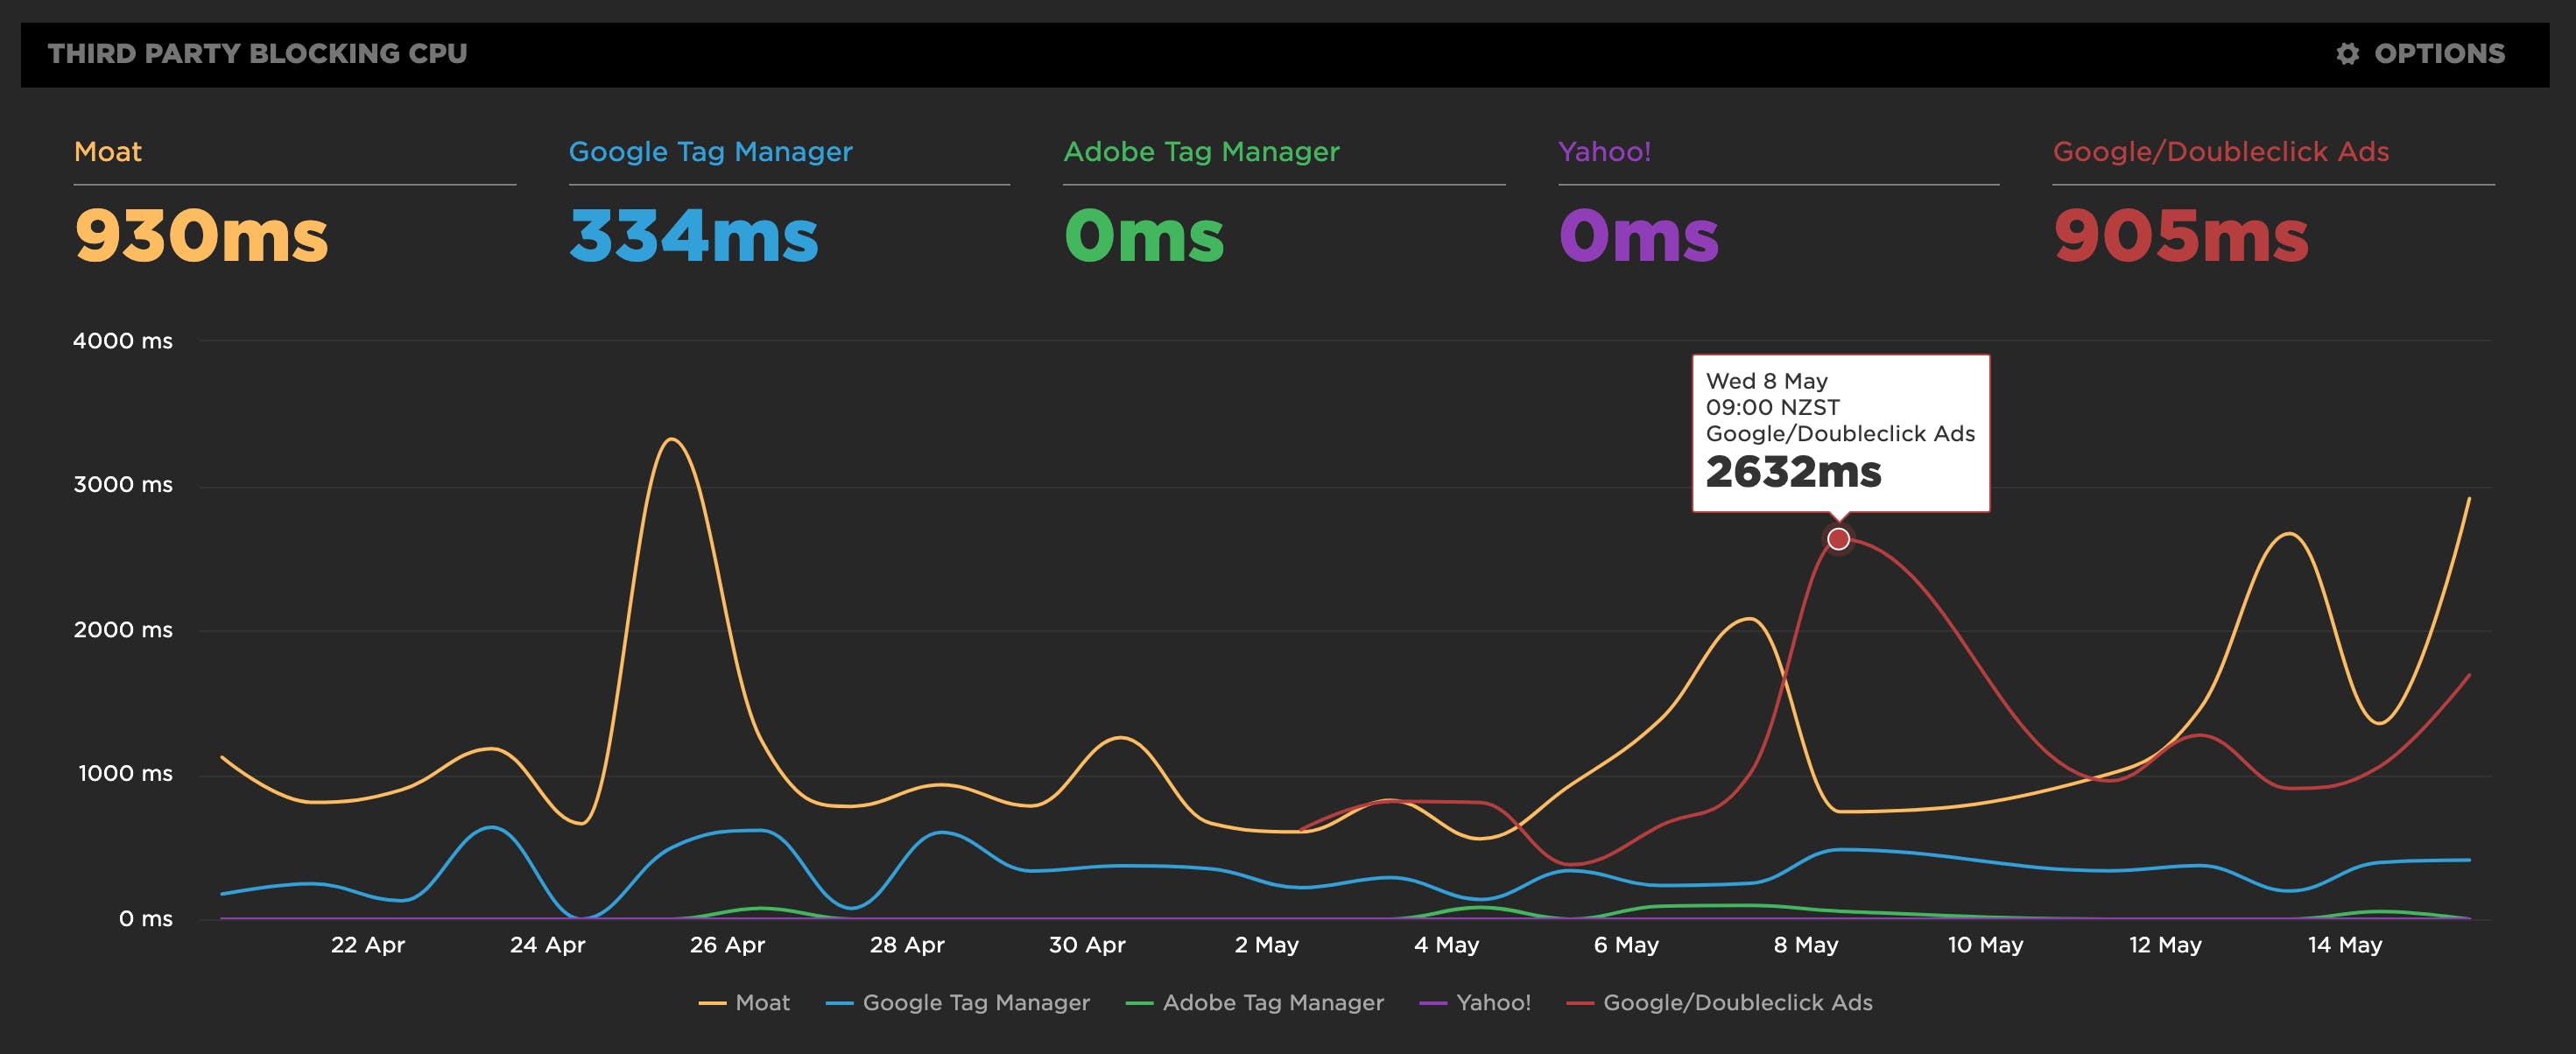
3. Create performance budgets for specific third parties or request groups
After you've started tracking third parties or a custom request group, you can create performance budgets and get alerts on any of your metrics.
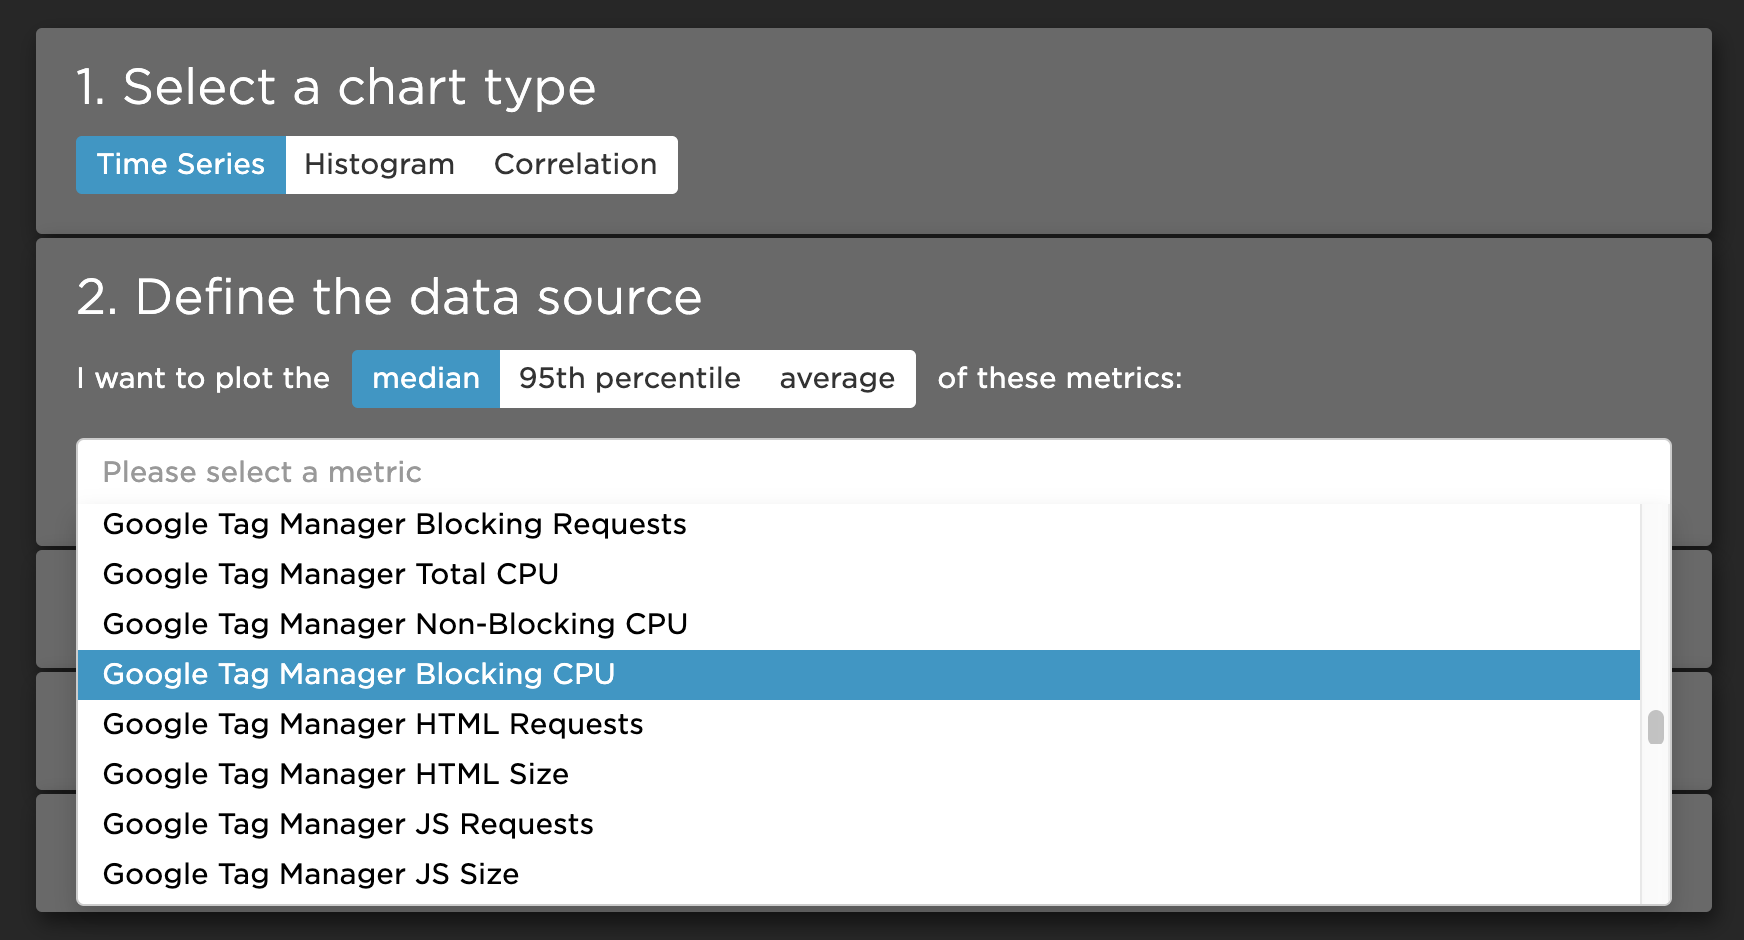
Visualising metrics for a 3rd-Party
So first check the grouping of your third parties or custom request groups, then start tracking them and set performance budgets to track their impact on your user experience!
Video walkthrough
If you'd like to see it in action, here's Cliff with a video walkthrough
Updated 10 months ago