See synthetic test details
How to drill down from your dashboards to individual synthetic test results. This is where you'll find waterfall charts and optimization suggestions.
Synthetic test results pages are where you'll find detailed information about individual tests, such as:
- Lighthouse scores and audits
- waterfall charts, which include key metrics like Backend time, Start Render, Speed Index, Hero Rendering times, Largest Contentful Paint, Time to Interactive, and Page Load
- other metrics, such as blocking JS and CSS
- CPU usage
- content breakdown (page size and number of requests)
- links to your detailed test results, timeline trace, and export HAR
How to navigate to individual test results
1. Go to any time series chart in your dashboards.
2. Select the page and filters you're interested in from the menu at the top of the page, then hit the green Go button.

Filtering a dashboard
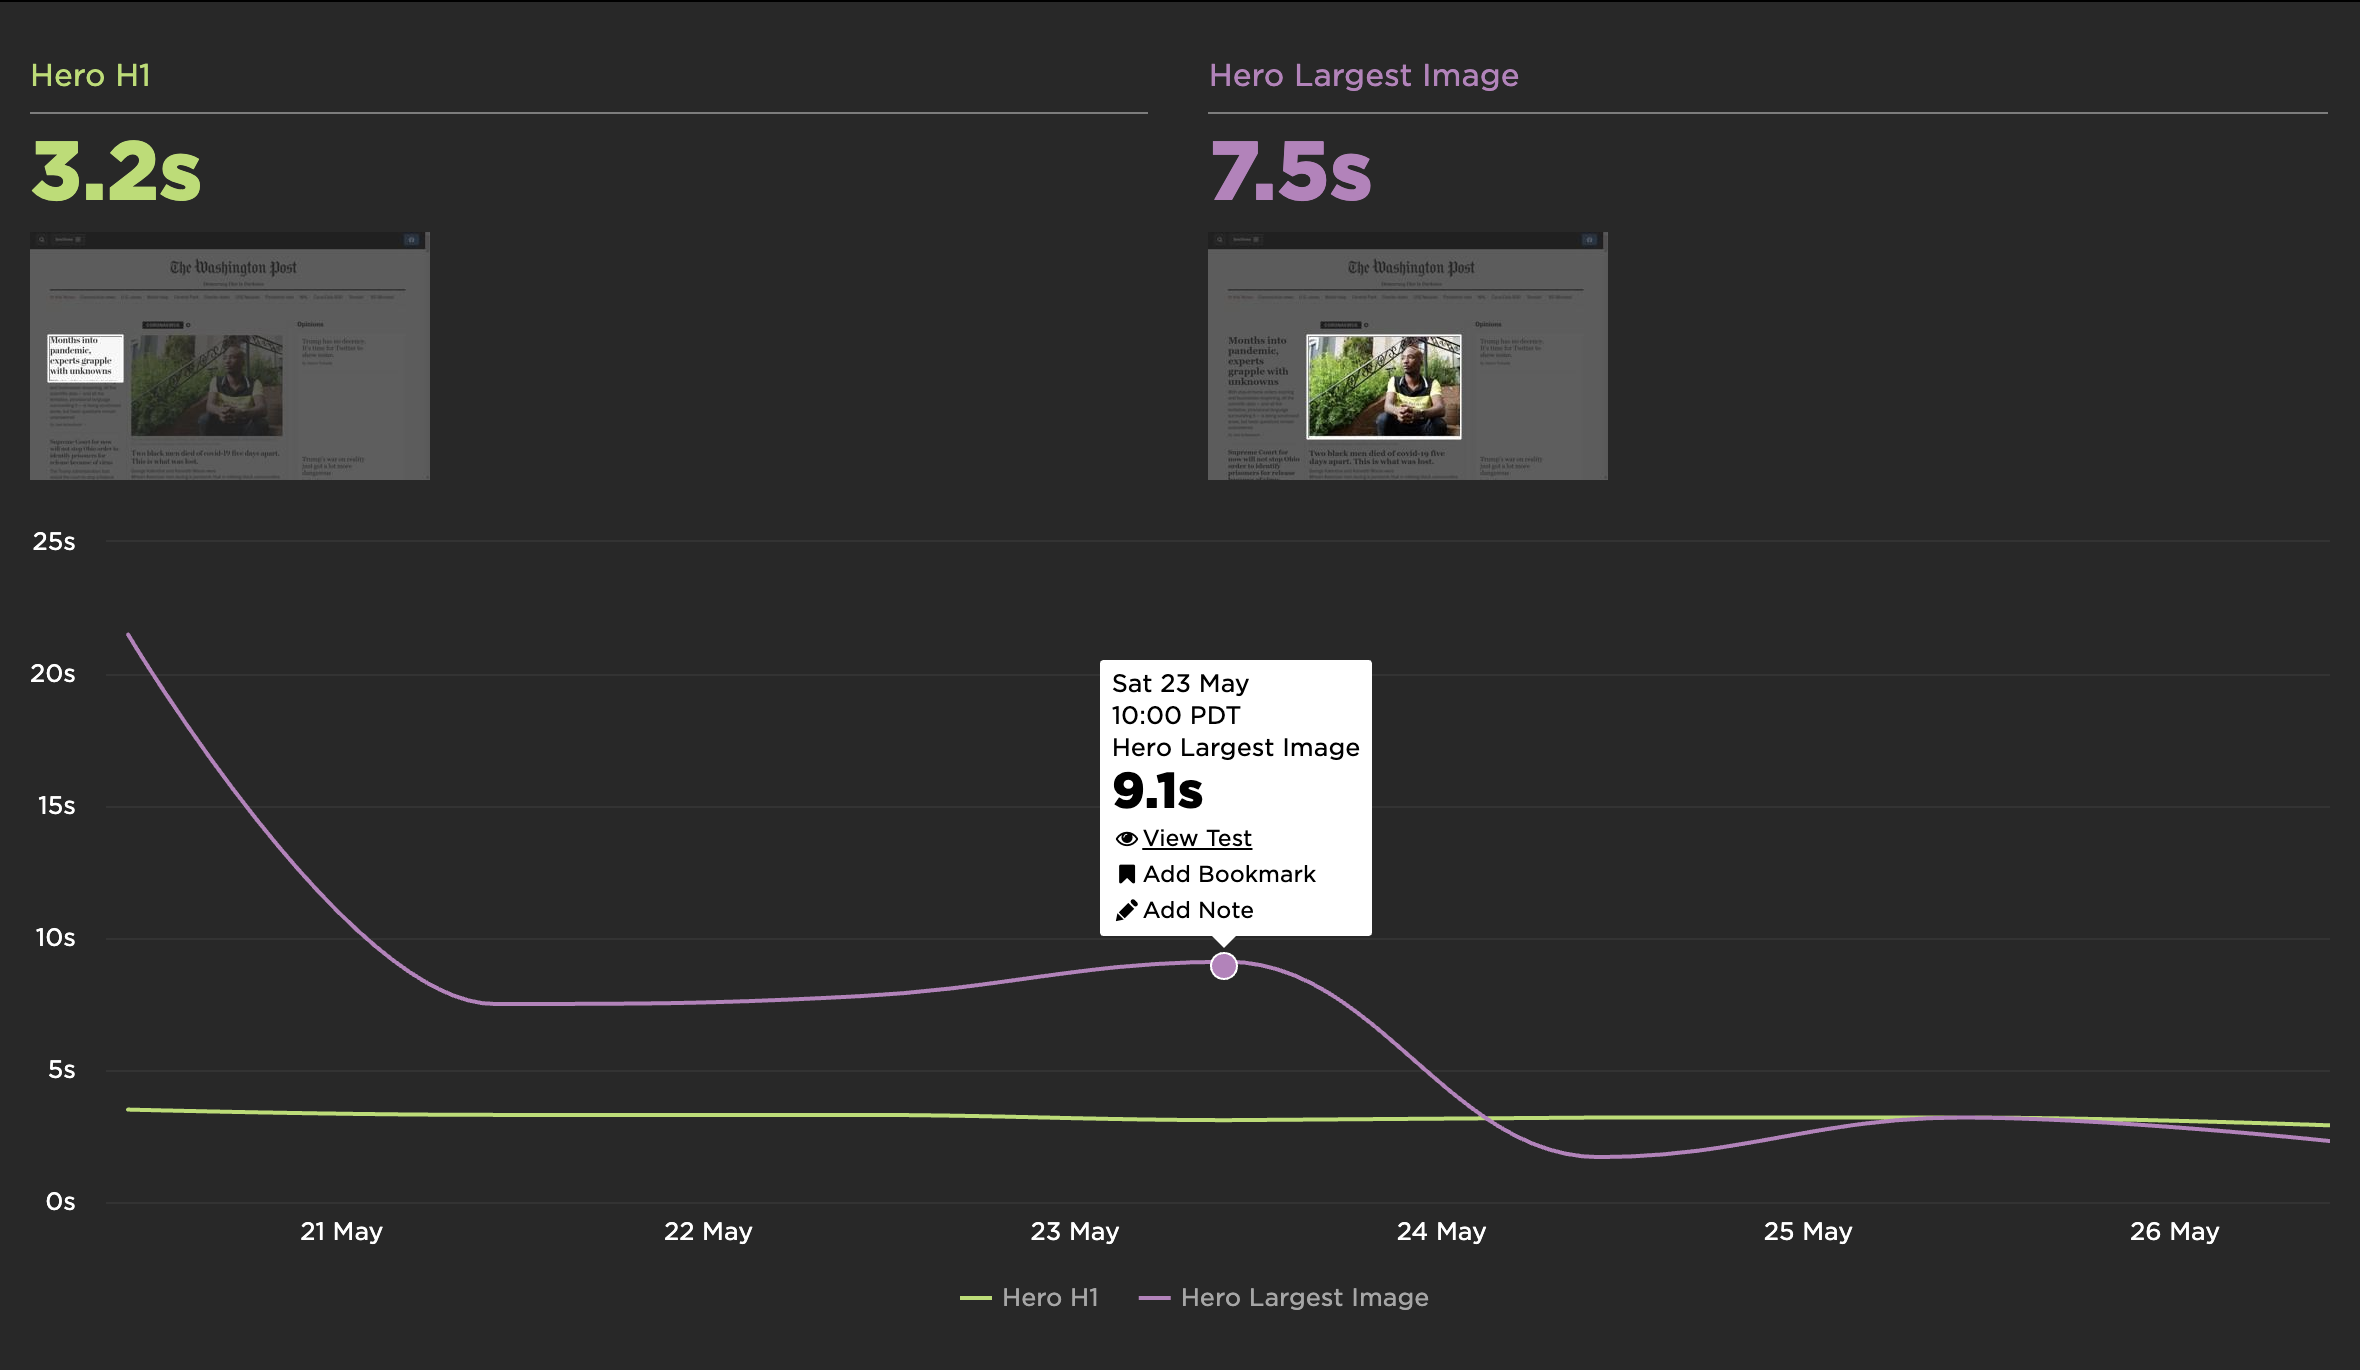
3. Click on the point on the timeline that you're interested in seeing the test result for. You'll see a pop-up with a View Test link, like this:

Choosing a test
4. Click the View Test link to go to the test results page.
InfoIMPORTANT: If you're trying to navigate to a test results page from any charts in your Favorites dashboards, you'll need to ensure that the chart uses medians, not averages:

Defining a metric
Updated 11 months ago