User Happiness
An aggregate metric – available in RUM – that captures user happiness.
The goal of making websites faster is to make users happier. Since user happiness can't be measured directly, various metrics are used as a proxy for measuring user happiness - Largest Contentful Paint, Cumulative Layout Shift, etc. Unfortunately, it's often difficult to decide which of these metrics best correlates to user happiness for your site. Further, when viewed in isolation these metrics might not reflect user happiness across your site.
To address these issues, we developed the User Happiness metric. It's a combination of multiple performance metrics that are closely tied to delivering a joyous user experience. Combining these metrics into an aggregate metric makes User Happiness more applicable across a wider variety of websites and conditions.
User Happiness is based on determining whether a page view is Happy, Unhappy, or Okay. This classification depends on how a page performs against a set of benchmarks.

Happy Page Views
A page view is considered Happy if it meets ALL of these conditions:
-
Time to First Byte (TTFB) is less than 800 ms
-
DOM Content Loaded is less than 1,500 ms
-
First Contentful Paint (FCP) is less than 1,800 ms
-
Largest Contentful Paint (LCP) is less than 2,500 ms
-
Cumulative Layout Shift (CLS) is less than 0.1
-
Interaction to Next Paint (INP) is less than 200 ms
-
The user did not rage click anywhere on the page
-
The user did not abandon the page before it finished loading
Note: if a user's web browser does not support any of the metrics, those metrics will not be counted towards the happiness score.
Unhappy Page Views
A page view is considered Unhappy if it meets ANY of these conditions:
-
Time to First Byte (TTFB) is more than 1,800 ms
-
DOM Content Loaded is more than 3,500 ms
-
First Contentful Paint (FCP) is more than 3,000 ms
-
Largest Contentful Paint (LCP) is more than 4,000 ms
-
Cumulative Layout Shift (CLS) is more than 0.25
-
Interaction to Next Paint (INP) is more than 500 ms
-
The user rage clicked anywhere on the page
-
The user abandoned the page before it finished loading
Okay Page Views
A page is considered Okay if it is neither Happy nor Unhappy.
Finding more about your user happiness
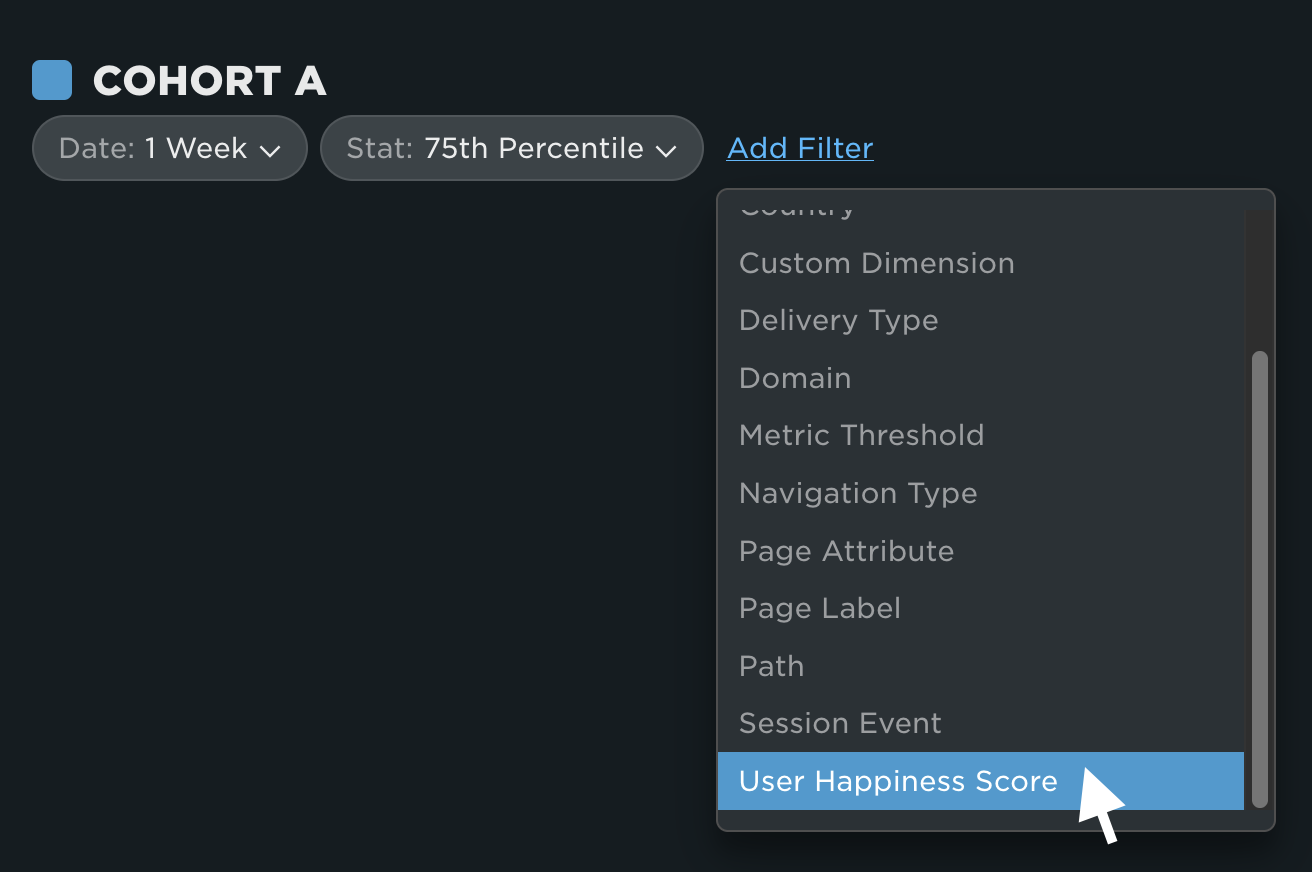
Using the User Happiness Score filter
You can investigate what is causing your users to be happy or unhappy by utilizing the User Happiness Score filter on your RUM dashboards.
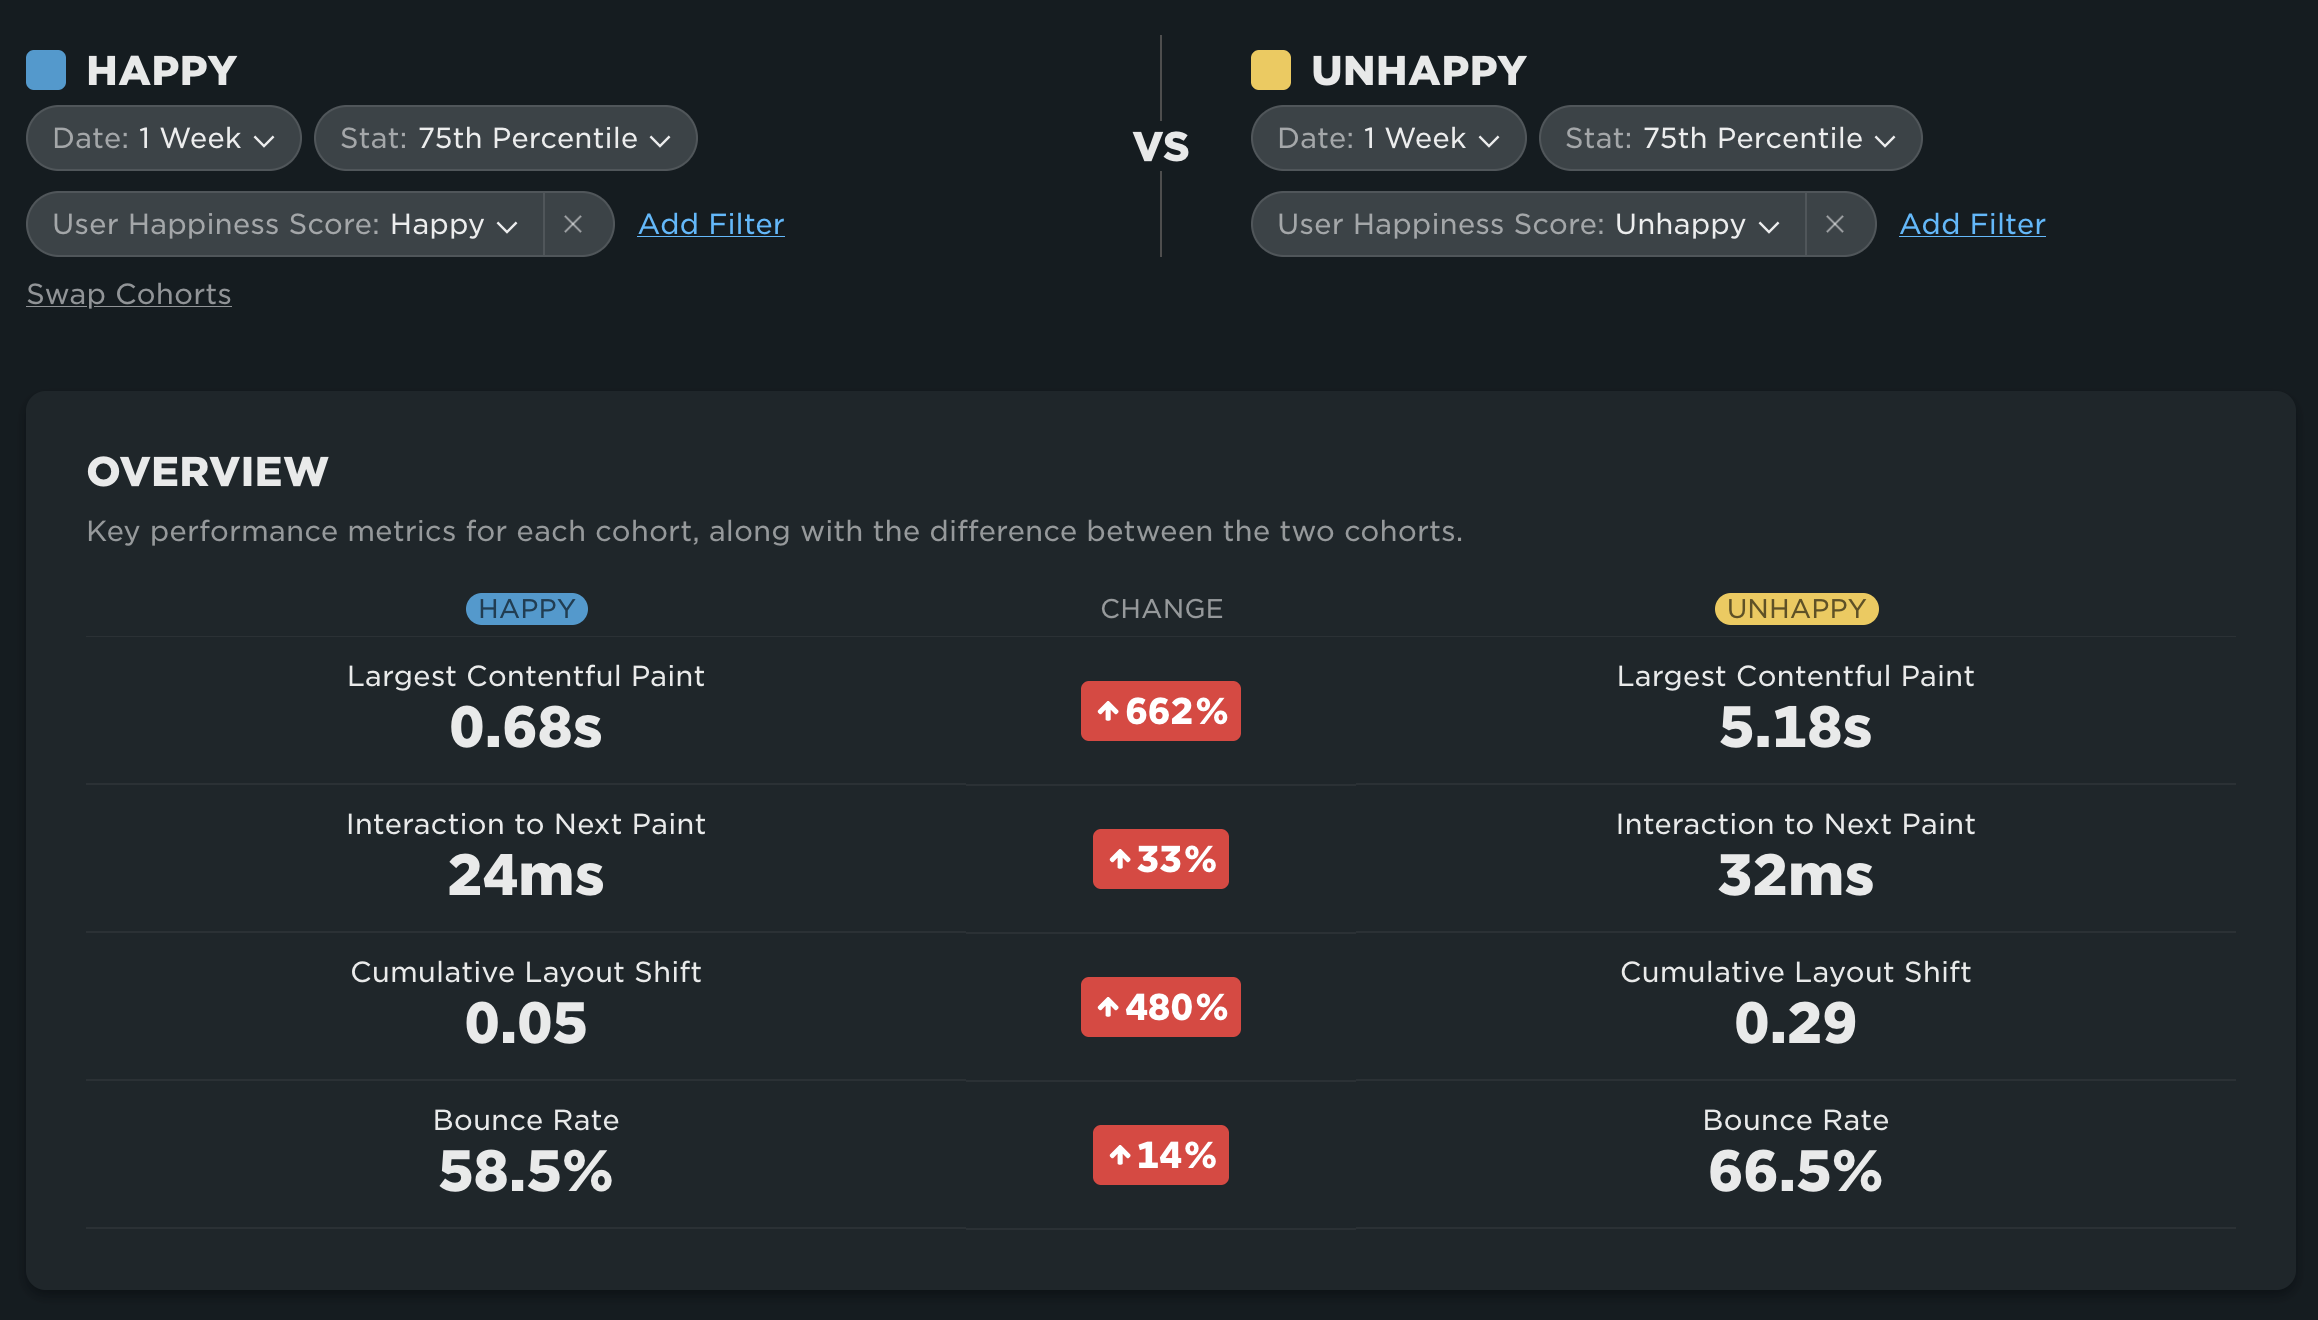
For example on the RUM Compare dashboard, we can compare happy users with unhappy users, and see which metrics we need to focus on to improve overall user happiness. In the screenshot below, we can see that LCP and CLS are definitely affecting user happiness, but INP is not.
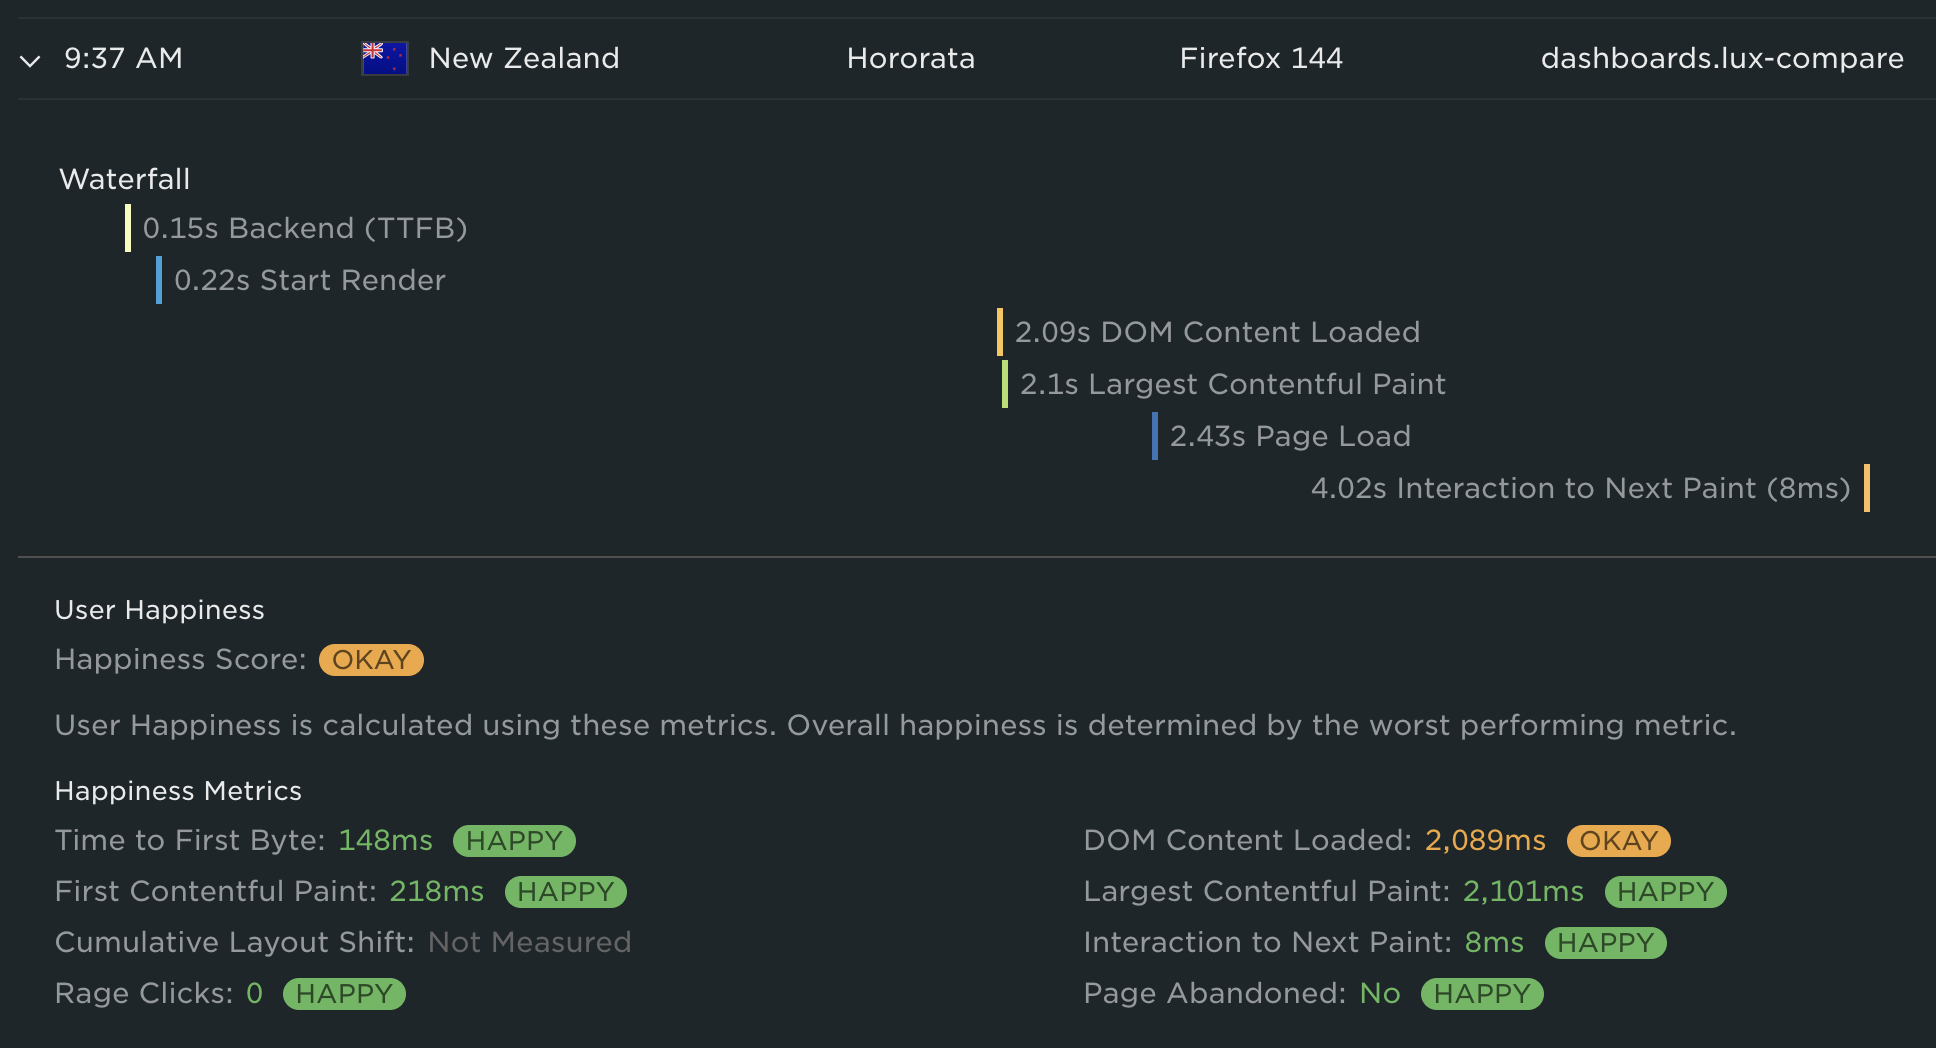
Viewing individual user happiness
You can also view user happiness right down at the individual page view level. To do this, go to your RUM Page Views dashboard, and expand any row. You will see the individual metrics that make up the user's happiness score. In the case of the screenshot below, the user's "okay" score was caused by DOM Content Loaded. All of the other metrics were happy.
Updated 8 months ago