Track resource size in RUM
How to use RUM and the PerformanceResourceTiming.transferSize API to capture size information for resources and resource groups
TL;DR
While the ability to capture transfer size for resources in the browser is awesome, in its current state it is an incomplete solution that if reported on FOR EVERYTHING by default could lead to false positives for RUM customers. However, there are some cool ways you can still use it.
What is PerformanceResourceTiming.transferSize?
“The transferSize read-only property represents the size (in octets) of the fetched resource. The size includes the response header fields plus the response payload body (as defined by RFC7230).”
This long awaited feature added to the PerformanceResourceTiming interface allows access to size information from an HTTP request. Additional size information for resources includes both the encoded and decoded body size of the request.
There are some great benefits of getting this information from RUM (vs. synthetic). A few examples:
- The ability to provide more understanding around the effective use of browser cache
- Understand whether you are serving appropriately sized images to the right device
- Get insight into size anomalies for pages that I may not be looking at with my synthetic testing
That sounds cool! What’s the downside?
We should just capture and report this for all of our resources on a page, right?
Unfortunately, you can’t. transferSize is only provided for resources served by the same domain or resources that pass the timing allow check algorithm. This means that for resources served by a third party, you are dependent on them to list the document’s origin or all (“*”) in the Timing-Allow-Origin header. As of the last check in HTTP Archive, this only included around 20% of resources.
Browser support is also an issue. As of the writing of this article, there is NO support for transferSize in Safari or iOS Safari. That’s a pretty big deal if you are trying to get this insight for such an overwhelming part of the population that carries an iPhone or uses Safari on their desktop.
If relied on for a look at total page size or size of third-parties, you risk both painting an incomplete picture of page weight as well as a high risk of noise as third parties change their use of Timing-Allow-Origin.
What are some ways I can still use it?
SpeedCurve RUM uses transferSize to calculate HTML size (see: Glossary of popular metrics), but aside from that we aren’t currently using the API for other first class metrics.
This doesn’t mean you can’t use this to improve your RUM data set! Using custom data, you can capture resource size and send it to RUM.
Here are some examples you can pull from depending on what questions you are trying to answer. Once you capture the data, simply pass it to RUM using the LUX.addData API.
I need to track and create a performance budget for a single resource:
I want to capture size information for a group of assets including "largest size" and "total size".
How can I see this data in SpeedCurve?
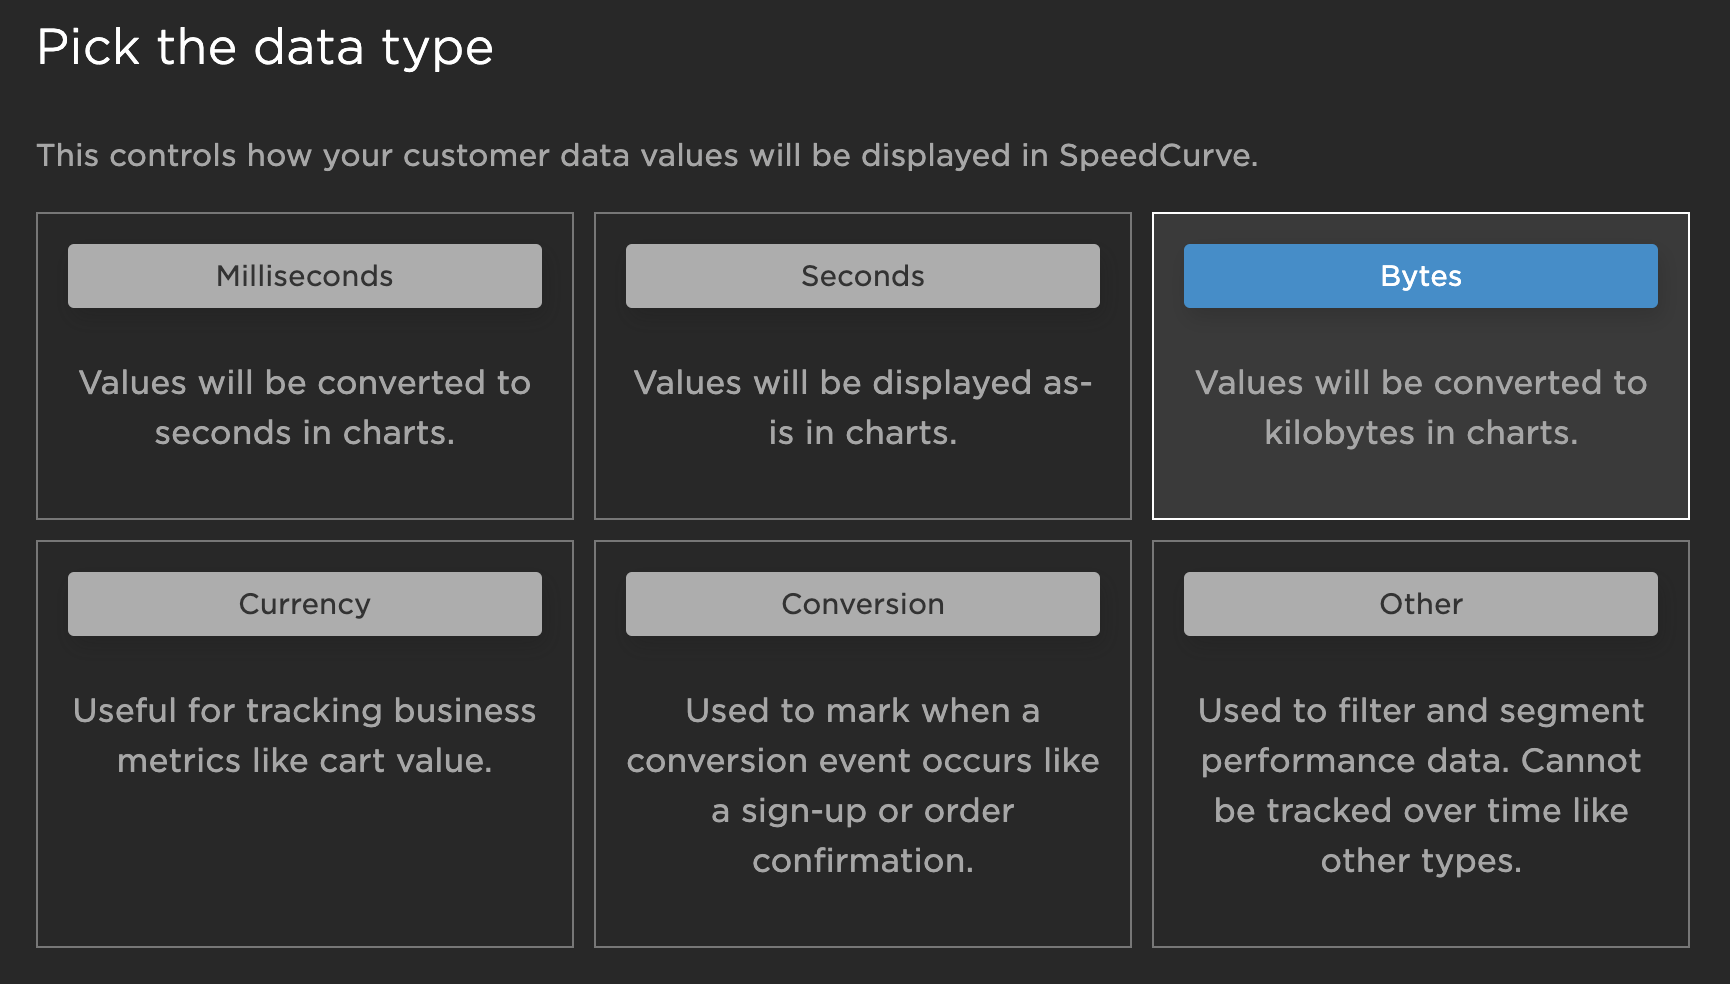
Once you are passing the data to RUM, setting up the custom metric is quite simple:
- Go to Settings.
- Scroll down to the Custom Metrics section and click "Add Custom Metric".
- Select "Custom Data" as the type of metric.
- Select "Bytes" as the data type.
- Specify the custom data variable name.
- Pick a human-readable name, for example Largest Image Size.
- Click "Save Custom Metric".

Configuring custom metrics
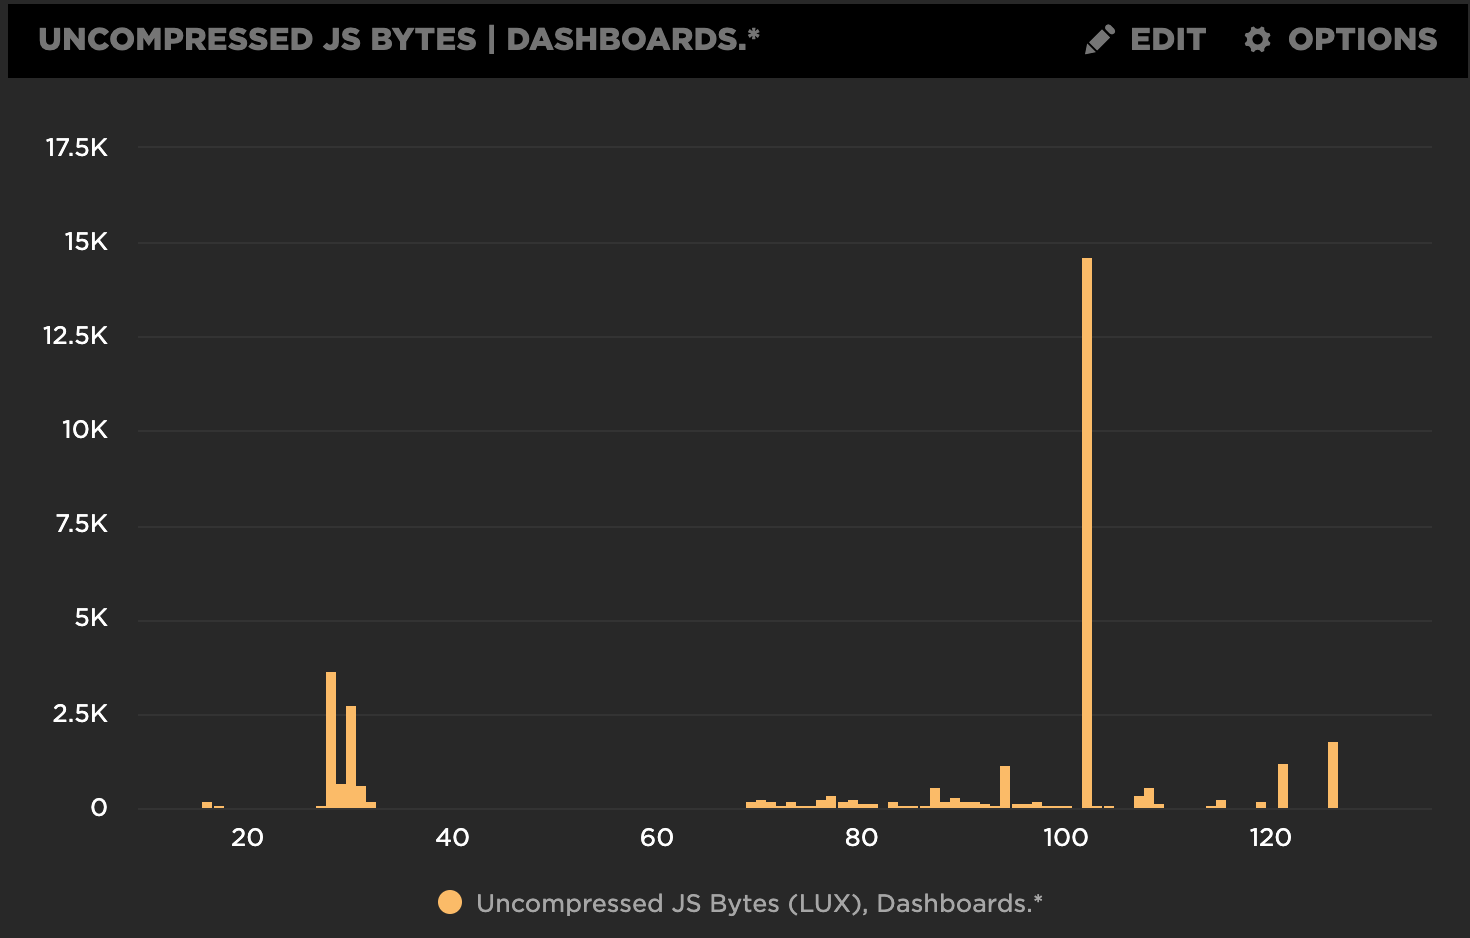
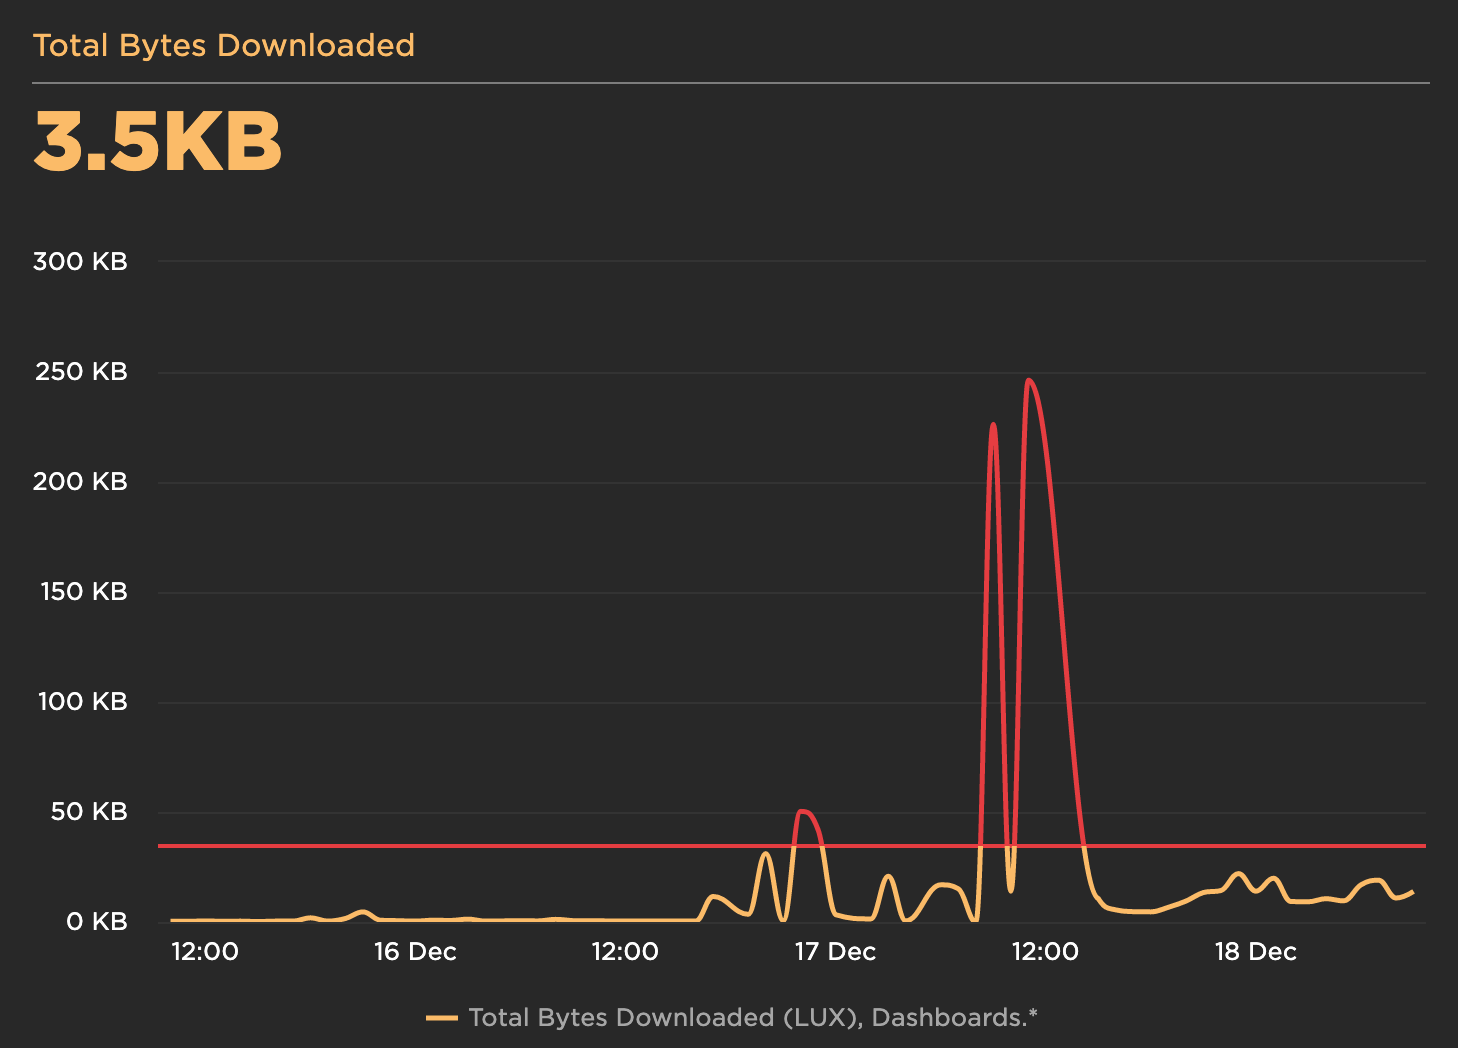
Now you can use this metric when creating custom dashboards in favorites, including histograms and time series charts!

Histogram of uncompressed script size

Tracking total bytes downloaded over time
We will continue to track the progress and adoption of transfer size and look at ways we can incorporate into RUM in order to add more value for our customers. If you have ideas, please let us know!
Updated 11 months ago