RUM data
Real user monitoring collects data from real users. Here are the types of data that SpeedCurve RUM does and does not collect.
Real user monitoring (RUM) is different from synthetic monitoring because it collects data from real user traffic instead of synthetic traffic. The data is gathered by adding our JavaScript snippet to your website as described in the Setup Guide.
What SpeedCurve RUM does *not* collect
If you have GDPR concerns, you will find it helpful to know that our RUM tool does not gather any personally identifiable information (PII) such as IP addresses, names, emails, or other metrics that could identify a user.
RUM also doesn't do any ongoing user tracking. It tracks the pages someone visits during a session, but if a user returns to the site later a new unique session is created.
What RUM does collect
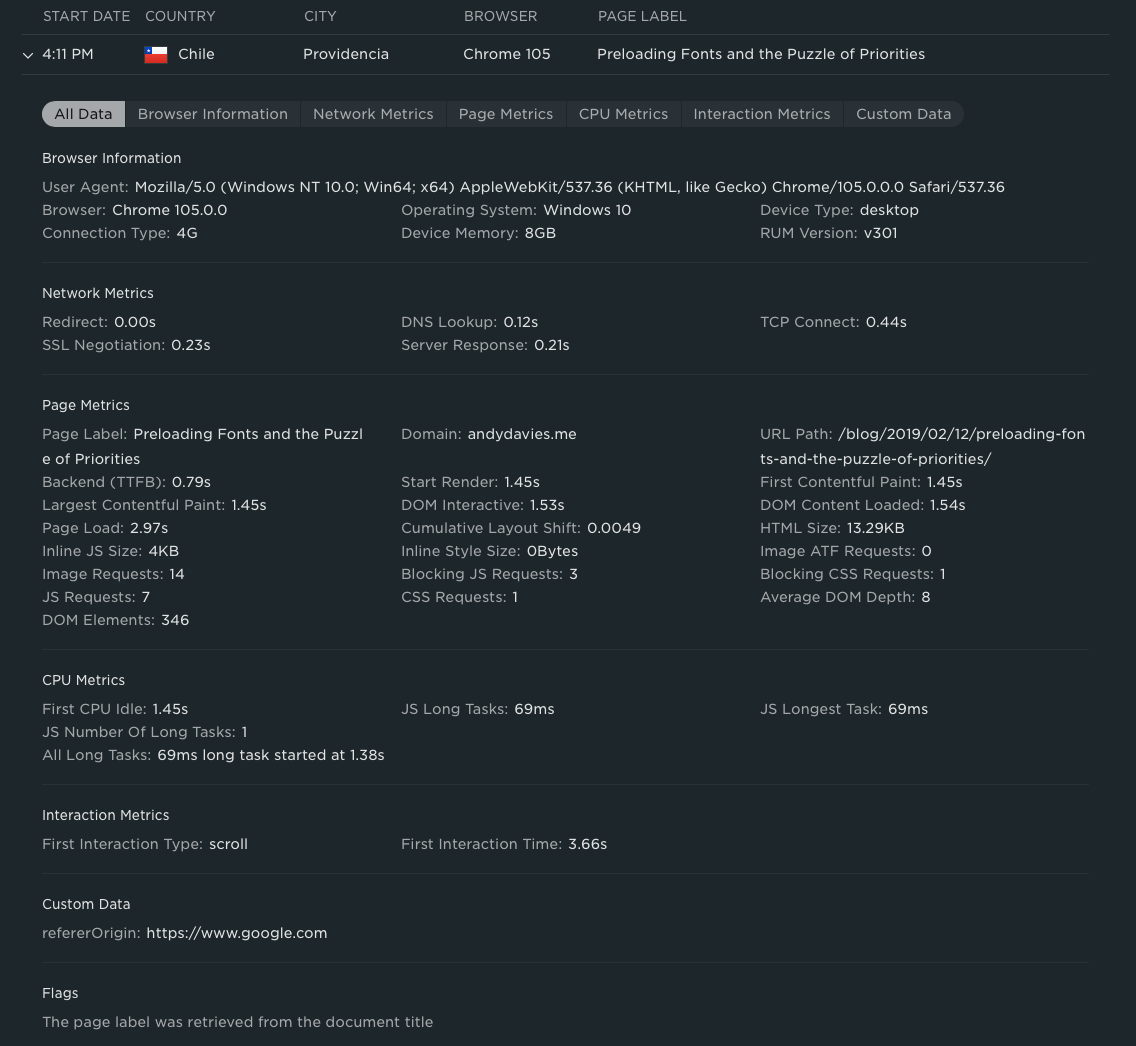
You can see an example of the RUM data gathers by clicking on a row in the Page Views dashboard in your account.

Data contained within an individual RUM beacon
The RUM information gathered is broken into the following categories.
Page Details
This category includes meta information about the page.
- URL
- Date
- Page label (defined by LUX.pagelabel;
document.titleused as a fallback)
Browser details
This category includes information about the browser that loaded the page.
- Location - city, country, continent
- Browser user-agent string
- Normalised browser information based on user-agent
- Device type (mobile, tablet, desktop) based on user-agent
- Device memory - estimated based on
navigator.deviceMemory
Navigation Timing
This category includes information from the Navigation Timing specification.
- navigationStart
- fetchStart
- redirectStart/End
- domainLookupStart/End
- connectStart/End
- secureConnectionStart
- requestStart
- responseStart/End
- domLoading
- domInteractive
- domContentLoadedEventStart/End
- domComplete
- loadEventStart/End
Paint Timing
This category includes information from the Paint Timing specification, and other paint- or render-related metrics.
- first-paint - aka, Start Render
- first-contentful-paint
- Largest Contentful Paint (LCP)
- Cumulative Layout Shift (CLS)
CPU Time
The Long Tasks API is used to gather information about the CPU including:
- Total CPU time
- Number of Long Tasks
- Longest Long Task
- Median Long Task
- First CPU Idle
User Timing
Marks and measures captured using the User Timing specification are reported in this category. We believe that User Timing marks and measures (aka, "Custom Metrics") are the best performance metrics to use because they are specific to what is most important in your site. Read the User Timing and Custom Metrics blog post for more information.
Page Design
SpeedCurve is focused on creating fast, joyous user experiences. We feel this requires combining typical performance timing metrics with information about website design. This category includes several innovative metrics that are unique to SpeedCurve.
- External Scripts - The total number of scripts fetched by the page.
- Stylesheets - The total number of stylesheets fetched by the page.
- Blocking Scripts/Stylesheets - The total number of scripts and stylesheets that are fetched in synchronous mode and thus block the HTML parser and rendering.
- Average DOM Depth - The average depth of a DOM element in the page's DOM hierarchy. This affects CSS and rendering performance.
- # DOM Elements - The total # of DOM elements. This affects CSS and rendering performance.
- HTML Size - The transfer size of the HTML document.
- Inline JS Size - The uncompressed size of any inline
<script>tags. - Inline CSS Size - The uncompressed size of any inline
<style>tags. - Connection Type - The effective connection type of the user's network.
- Viewport - The width and height of the browser viewport. This is important for knowing how much content is visible to the user when the page loads.
- Document - The width and height of the document. This is important for determining how much of the content is not visible and could potentially be lazy-loaded to improve initial rendering.
Interaction (IX) Metrics
For many websites, how quickly users engage with the page is an important user experience metric. If these metrics increase it could be a sign that the page is rendering slower, or a design change has made the site more difficult for users. This category captures metrics about how and how quickly users engage with the page.
- First IX Type - The first type of interaction the user had with the page: scroll, click, or keypress.
- First IX Time - When the first interaction time occurred (relative to navigationStart).
- Element ID clicked - The ID or data-sctrack attribute of the DOM element that was clicked or keypressed. See the LUX data-sctrack API for more information.
- Interaction co-ordinates - the X and Y co-ordinates of the input event (if available).
- First Input Delay (FID).
Custom Data
You can use the RUM API to gather any data you want, for example, cart size, A/B testing, and conversion information. For more information see the Custom Data documentation.
JavaScript Errors
SpeedCurve RUM collects the number of JavaScript errors on the page as well as the error details.
Housekeeping Data
The beacon also includes some data we used for housekeeping
- Session Id (lux_uid) - this ID remains consistent across a user's session, and is stored in the lux_uid cookie. The cookie expires 30 minutes after the visitor's last page view.
We're constantly extending RUM to gather other valuable information beyond what is listed here. For more details about each metric, see this support article.
Updated 5 months ago