Add notes & deploys
Keep track of changes to your site and deploys. Here's how to add and edit notes in your charts – either manually or with our Deploy API.
Adding notes is a great way to keep a track of changes you're making to your site and then correlating them to any performance changes you're seeing.
Notes are shown on your charts as a vertical line.
Add a note manually
To manually add a note, you can click on any point on a chart and then select "Add Note".
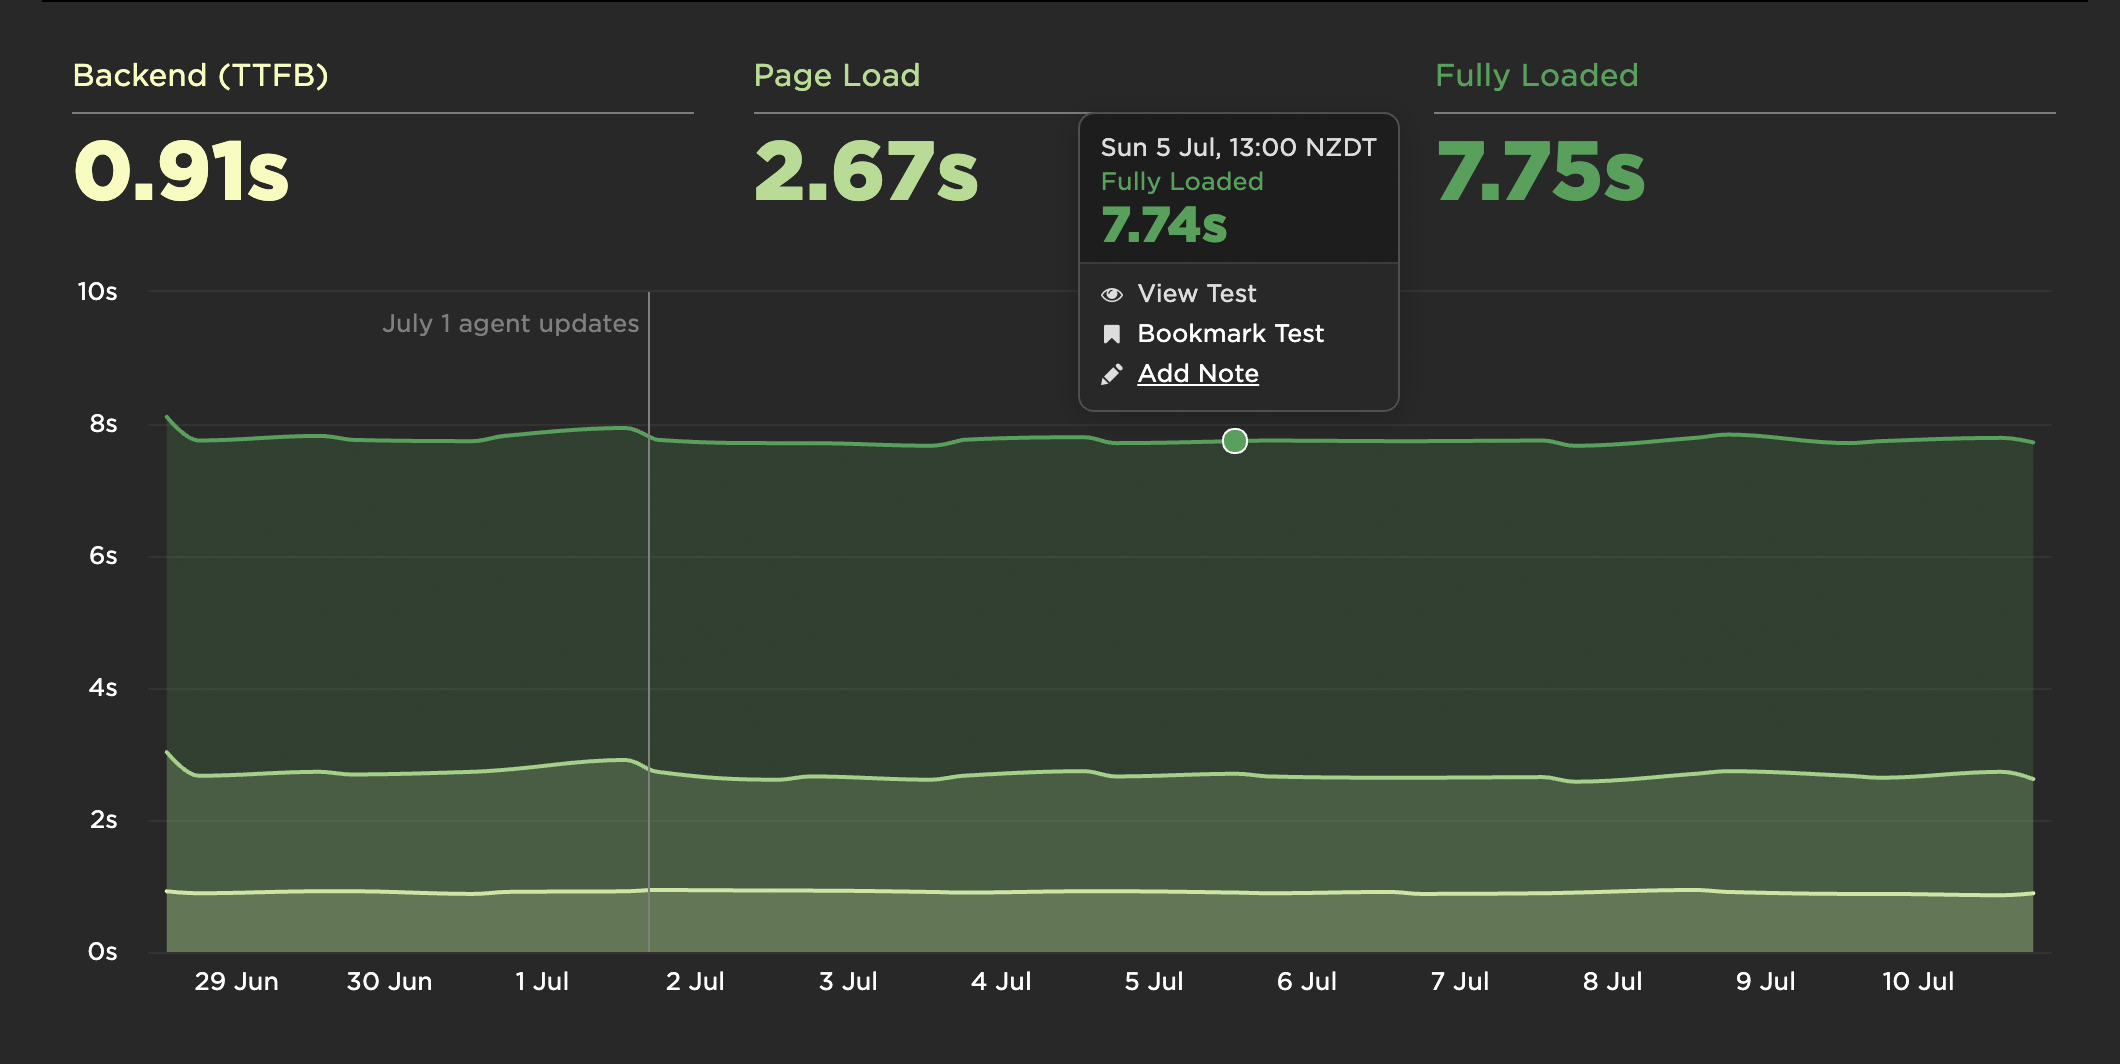
Adding a note manually
You can also go to your Settings page to add or edit existing notes.
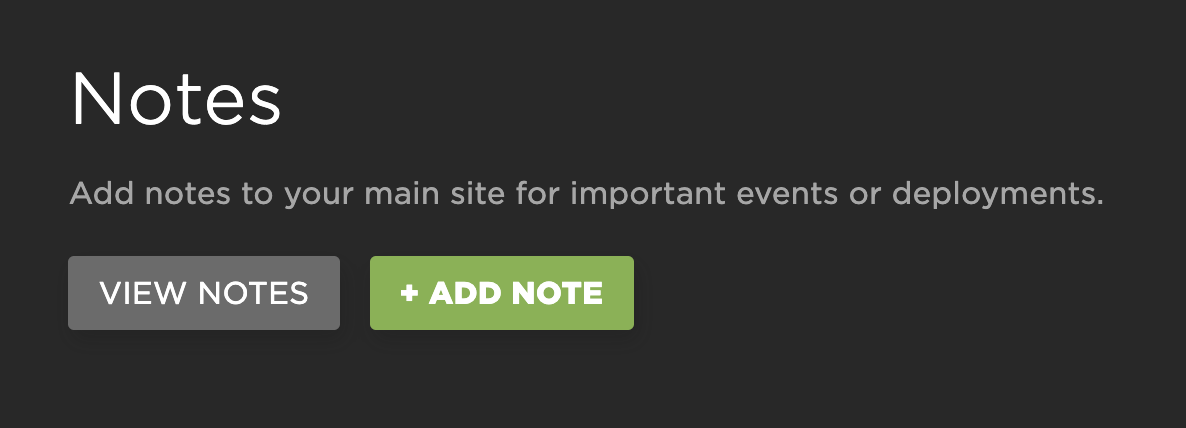
Adding a note via Settings
Important to know
- When you add a new note via a chart, the note will be applied only to the site being tracked in that chart.
- When you add a new note via your Settings page, by default the note will be applied to your charts for all the sites you're testing. You can opt to specify an individual site. Then the note will only be applied to charts for that site.
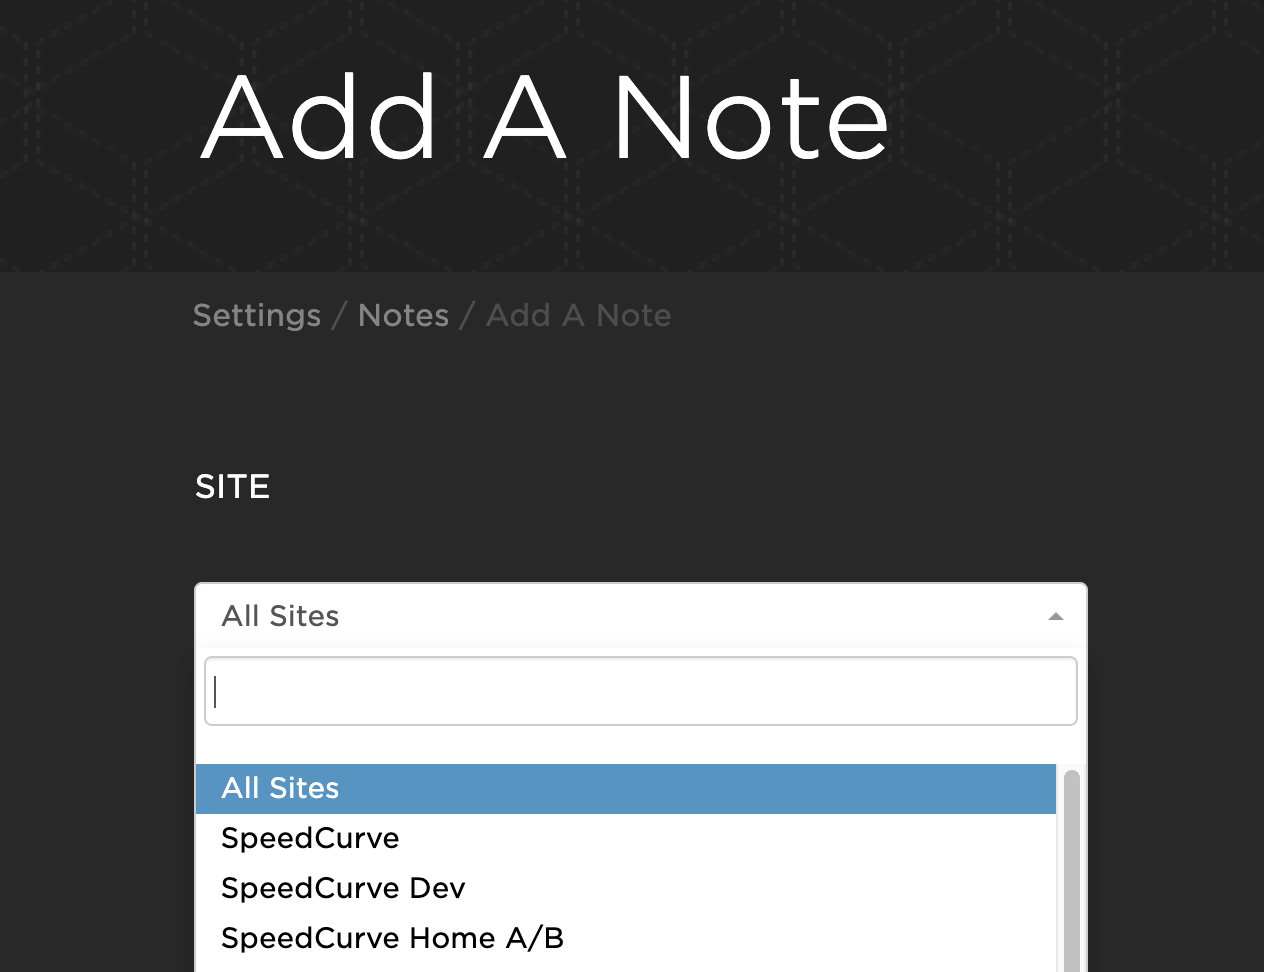
Specifying the site a note is for
Add a note automatically after each deploy
You can also use our Deploy API to let us know each time a deploy is pushed to production. As part of the API call you can add a note to track how deploys are affecting performance. This is particularly helpful if you've integrated synthetic testing into your continuous integration / delivery (CI/CD) process.
See all your notes
Go to the 'Notes' section of your Settings page and click 'View Notes'. You'll see all your notes.
Edit a note
To edit an existing note, go to the 'Notes' section of your Settings page and click 'View Notes'. You can then click on any note to edit it.
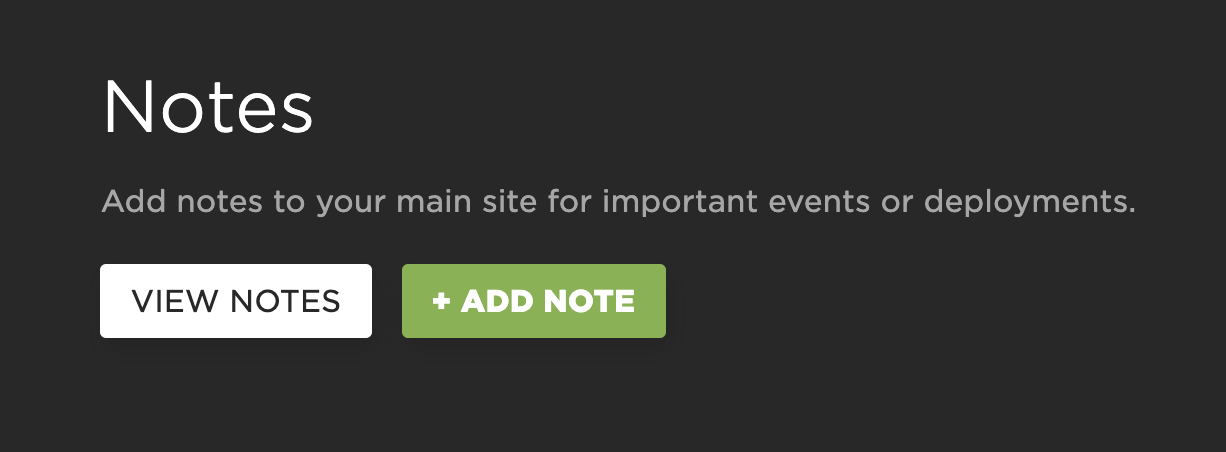
VIewing exiting notes
Hide notes
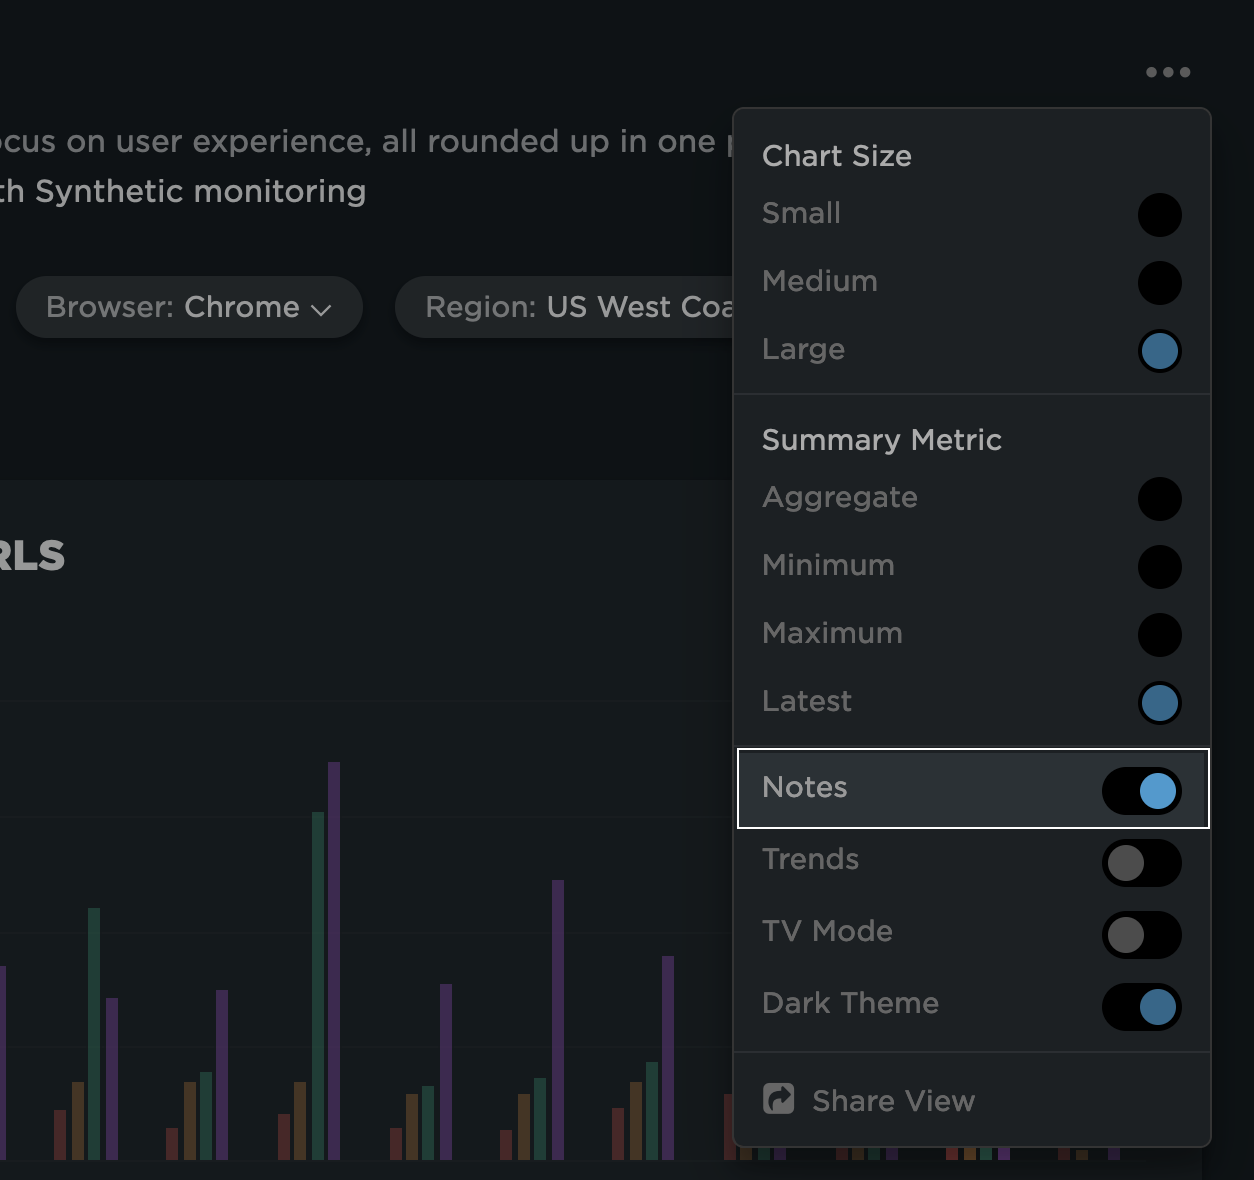
If you want to make your charts less busy, click on the three dots in the top-right corner of any dashboard and toggle the Notes option. This will hide all notes across all charts.
Updated 8 months ago