Monitor JavaScript performance
How to use SpeedCurve to comprehensively monitor your JavaScript performance.
In almost all modern web pages, JavaScript is the number one cause of poor performance and frustrating user experiences. Despite this, it remains one of the most difficult aspects of page performance to measure and monitor. This guide will take you through the various ways to monitor your JavaScript performance.
JavaScript Dashboard
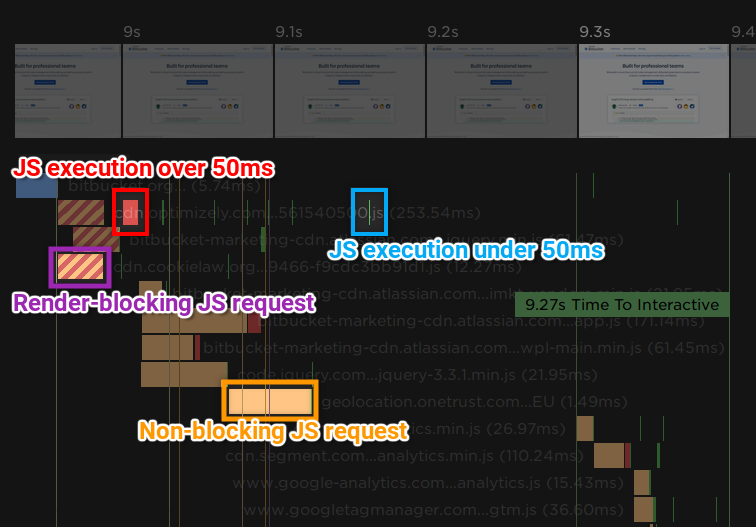
SpeedCurve's JavaScript dashboard is the best place to get an overview of the JavaScript performance for a single page. The JavaScript waterfall chart shows all network requests that execute JavaScript on the main thread. It has a few important components:
- The blue (HTML), orange (JS), and orange-striped (render-blocking JS) bars show the start time and duration each network request.
- The red blocks to the right of each network request show JS execution that blocks the main thread for more than 50 ms.
- The green blocks to the right of each network request show JS execution that blocks the main thread for less than 50 ms.
- The vertical lines show page-level metrics like Start Render, Page Load, and Time To Interactive.

Below the waterfall, script execution time is grouped by domain to help you identify problematic third-parties.
Difficulty: Easy
Pros:
- No additional setup required.
- Highlights resources that spend a long time executing JavaScript.
- Easily identify problematic third-parties by grouping JavaScript execution by domain.
Cons:
- Doesn't currently drill down to individual function calls.
First CPU Idle
First CPU Idle is a metric that represents the time until the page is considered to be usable and will respond to user input. This metric is a good proxy for your page's overall JavaScript performance - a high First Interactive time could indicate that too much JavaScript is being run early on in the page load process.
Difficulty: Easy
Pros:
- No additional setup required.
- Has a relatively strong correlation with user experience.
Cons:
- Only available in synthetic tests.
"CPU Time" Metrics
SpeedCurve has several different "CPU Time" metrics that measure the total CPU time spent up until a certain point in the page load process. These metrics are split by category (Scripting, Layout, Painting, & Loading) and by milestone (Start Render, Page Load, & Fully Loaded). For example, the metric called "CPU Scripting Page Load" is the total CPU time spent on JavaScript until the onload event.
Difficulty: Easy
Pros:
- No additional setup required.
- Gives a high-level overview of the amount of JavaScript being run on the page.
- Different milestones enable you to focus on the point in the page load that you want to optimise.
Cons:
- Only available in synthetic tests.
User Timing API
The User Timing API is a W3C standard that specifies an interface for developers to create timestamps that are part of the browser's performance timeline. SpeedCurve can extract all of the User Timing events in your pages, giving you the freedom to record any performance characteristics that you like. Examples of what you can measure with the User Timing API.
Difficulty: Moderate
Pros:
- Available in both synthetic tests and RUM.
- Measures the things that are important to you and your users.
- Offers almost unlimited granularity - you can measure the time it takes to execute an entire script or just a single line.
Cons:
- Requires adding performance.mark() and/or performance.measure() calls to the page.
- Identifying the right things to measure can be hard.
JavaScript Long Tasks
The Long Tasks API is a W3C standard that specifies an interface for developers to observe and record JavaScript activity of over 50ms. In a way, it is the RUM equivalent of the synthetic "CPU Time" metrics.
Difficulty: Easy
Pros:
- Highlights problems that real users experience due to slow JavaScript execution.
- SpeedCurve's RUM already collects this data.
Cons:
- Not yet supported across all browsers.
First Input Delay (Depreciated)
First Input Delay is a method of measuring the latency between a user's input and the browser actually responding to that input. A high First Input Delay time can be an indication that a page is executing too much JavaScript in its event handlers.
Difficulty: Easy
Pros:
- Is a good proxy for real user experience.
- SpeedCurve's RUM already collects this data.
Cons:
- Much smaller volume of available data, since it requires that users interact with the page.
- Not available in synthetic testing by default.
Chrome Timeline Trace
When SpeedCurve runs a synthetic test in Chrome, it records the timeline trace. This trace can be downloaded and loaded into Chrome DevTools to perform advanced performance analysis. You can download the timeline trace from the Test dashboard.
Difficulty: Hard
Pros:
- Automatically measures everything on the page.
- Can drill down to individual function calls.
- JavaScript execution can be easily correlated with other data like paint events and frame times.
Cons:
- Requires an in-depth knowledge of the source code and a moderate understanding of the browser.
- Large amount of data can be overwhelming and difficult to interpret.
- Extremely difficult to extract meaningful data in an automated/programmatic fashion.
Updated 9 months ago