Setup Guide
A step-by-step guide for admins
Step 1 • Navigating your SpeedCurve Settings
The majority of your setup will be controlled within your Settings page. You can access your SpeedCurve Settings from the left nav, illustrated here.
After navigation, if you see the message below, it is because you do not have either Team or Admin privileges. For access, please request from your organization's Admin(s).
Learn more:
Step 2 • Understand your synthetic usage
The first section of your Settings page displays your synthetic usage. This informs you how many synthetic checks you have used for the month and how many are scheduled for use out of your allocated budget. More information about managing your usage, including viewing your usage history can be found below.

Learn more:
Step 3 • Modifying your global settings
Before you add sites and URLs to your synthetic testing, you need to identify which settings you'll want to use globally. Here is a video walkthrough of some of the common global settings you'll use, including regions, browsers, test times, and number of checks per test.
Adding additional Regions, Browsers, Times and Checks
Learn more:For a full walkthrough of your Settings options, see the videos posted in Admin Settings
Step 4 • Add sites and URLs for testing
Sites
It's important to know that each site you test can have a different settings configuration. For example, you may wish to test your own site several times a day across a number of browsers and regions. You may wish to test a competitor's site only once a day across a smaller number of browsers and regions.
To manage an individual site's test settings, click on that site on your main Settings page. Your site settings page is where you'll define the URLs you want to test for a given site, as well as other test settings you want to use from your global settings above. The configuration of a site is intended to be used to declare the unique web property you are testing. This includes environments you may be testing (i.e. production, staging) or other sites outside of your control, such as a competitor's site.
Important!When defining a new site, it is very important that you select what type of site it is. This is required for use in Competitive benchmarking
URLs
Within site settings, you will define which URLs you want to test for a site. This is accomplished by entering in a url or by creating a synthetic script. Beside each URL, you will also apply a page label name, which will help you to identify the URL in your dashboards and most importantly allow you to compare other urls in cases of competitive benchmarking and matching up with your RUM data.

Simple url

Url defined by a script
Important!Defining page labels is a critical step in your setup. Using the same page labels for competitors will allow you to benchmark key pages. For example, if you want to compare your home page to a competitor's home page, you will need to label each URL 'Home'. Matching up your synthetic page labels with your RUM page labels enables correlation between RUM and synthetic data for use in Vitals, Improve and Favorites dashboards.
Adding RUM domains to a synthetic Site
Contained within your Site settings is a section for RUM Settings. This is NOT the primary place you'll edit your RUM settings (see below). This is where you indicate:
- Which domains you want to collect RUM data for
- Which RUM domains you want to associate with the Site. This is useful when you are using both datasets in areas such as the Vitals dashboard, Custom dashboards & charts, Home dashboard and others.
Watch this video explainer for a full walkthrough of your site settings.
Learn more:
Step 5 • Configuring RUM
Real user monitoring (RUM) is a critical part of every solid performance management plan. If you choose to enable RUM within SpeedCurve (and we hope you do!) you'll need to follow some basic steps outlined in RUM Settings.
1 • Add the RUM snippet to your pages and set your sample rate
You can get the snippet at any time by going to Settings > Edit RUM.
Where to insert the snippet
The lux.js script is loaded asynchronously so it won't harm the performance of your site. It's best to put the snippet as early in the page as possible, i.e. at the top of the HEAD element. This ensures that we are able to collect as much data as possible for each page.
Single-Page App (SPA)
Follow the guide for using SpeedCurve RUM with a SPA.
How to adjust your sample rate
You can set your RUM sample rate on your Settings page. The default sample rate is 100%. You should change the sample rate to a value that matches the plan you want to sign up for.
For example, if your site typically gets 900 million page views per month, and you want a RUM plan that covers a maximum of 10 million page views per month, then set the sample rate to 1%. Questions about what you should set your sample rate to? Check out this post.
2 • Add the domains you want to monitor
As mentioned above, you'll add the domains you want to monitor to your Site Settings. They will be shown in your RUM Settings page once they've been added.
3 • Add page labels
This is a crucial step in your RUM setup. By default, pages are grouped by their page title (document.title), but you'll want to segment your pages by type or template. This is very important for using great features such as the vitals dashboard and combining your synthetic and RUM data. This also streamlines the number of page labels in your RUM filters, making the data much more actionable.
Page labels can be created in one of three ways (in priority order):
- Using the RUM JS API
- Assigning page labels based on url patterns
- Using existing JS variables
WarningIf not matched with one of the methods above, document.title for the page will be used. This can lead to a large number of page labels, making it difficult to navigate and filter your data.
Using the RUM JS API
Pros: Absolute control over labeling
Cons: Requires code changes
To programmatically assign labels, simply call the LUX API from your pages as illustrated here:
LUX = window.LUX || {};
LUX.label = "article";
Assigning page labels based on url patterns
Pros: No code changes and control is in the hands of the admin
Cons: Could be overwritten/changed by other Admins and changes are not retroactive
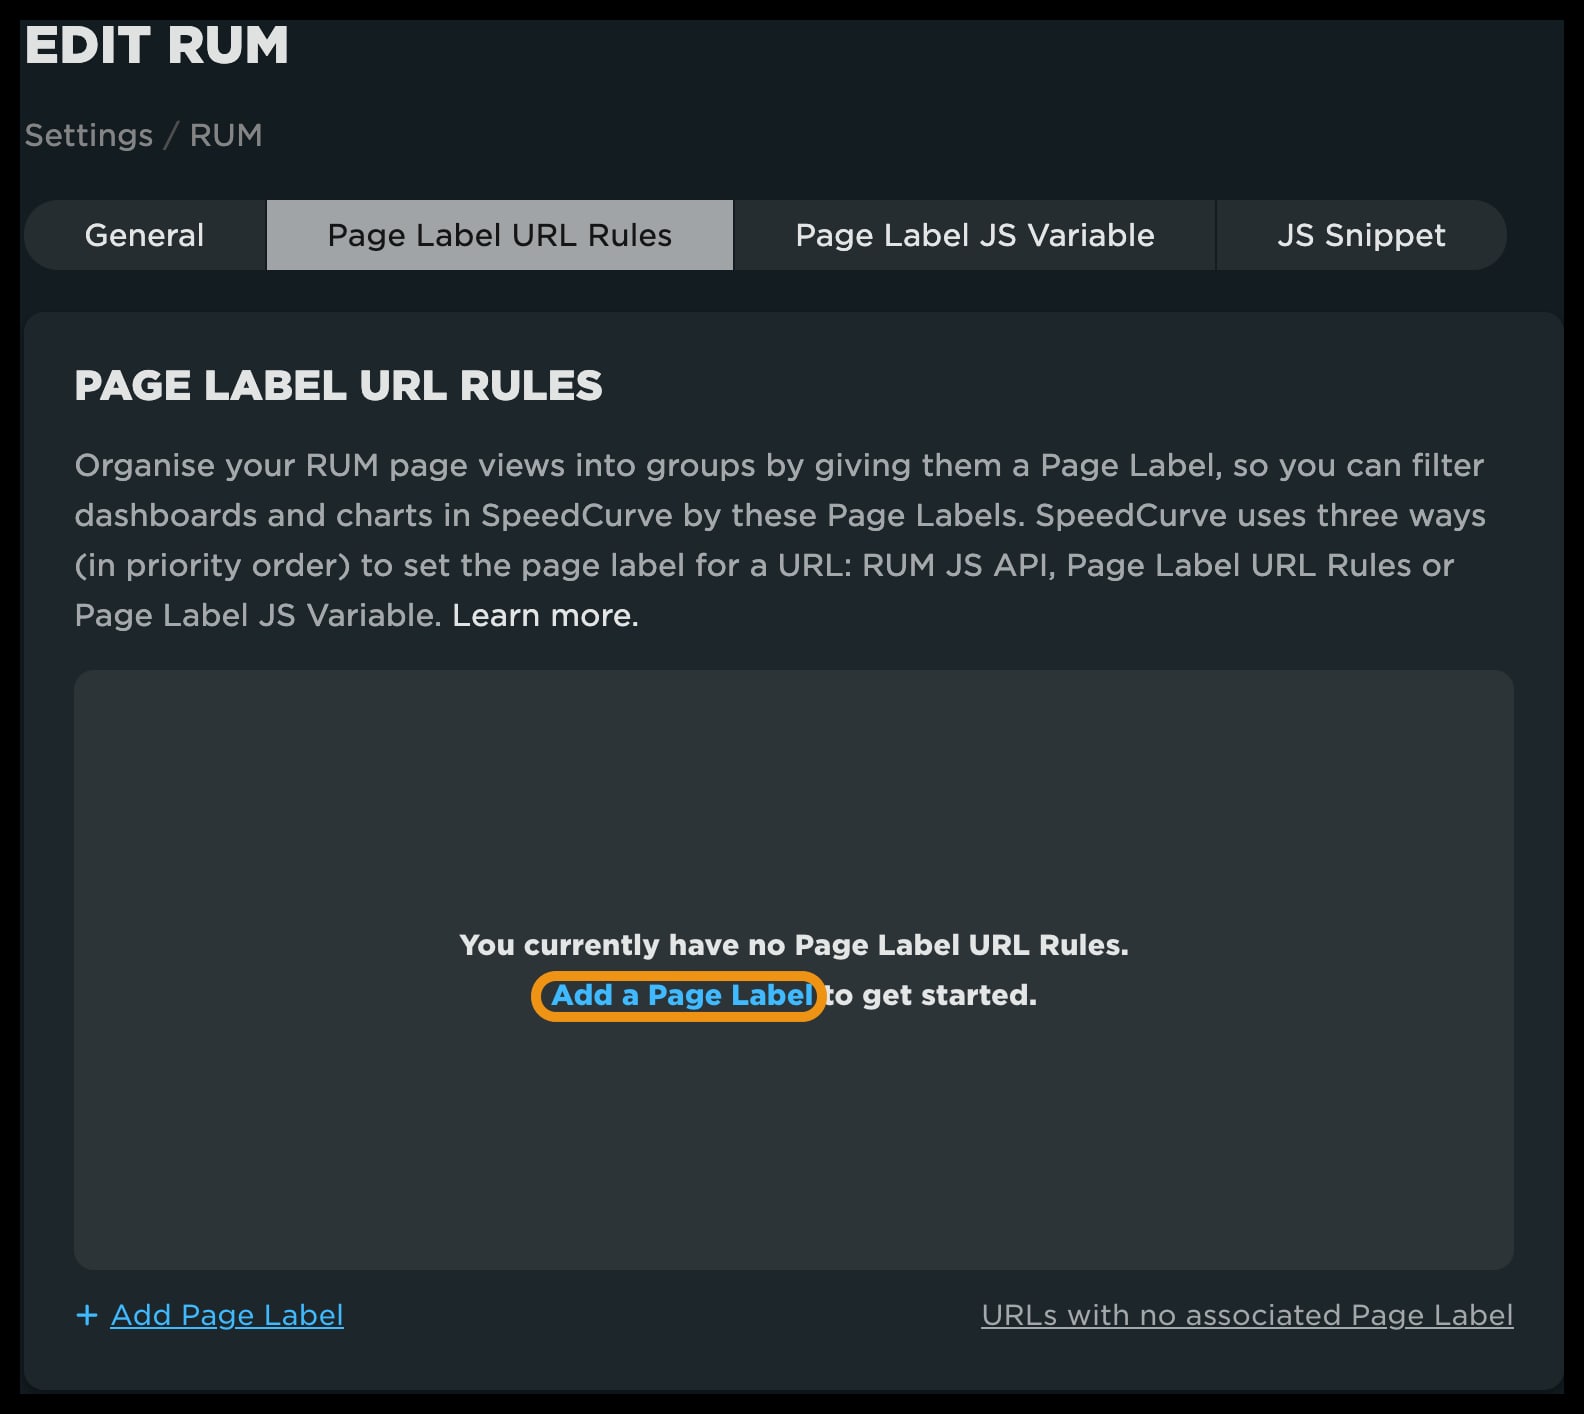
From the top menu of your RUM Settings, click on 'Page Label URL Rules'. Then click 'Add a Page Label' to get started.
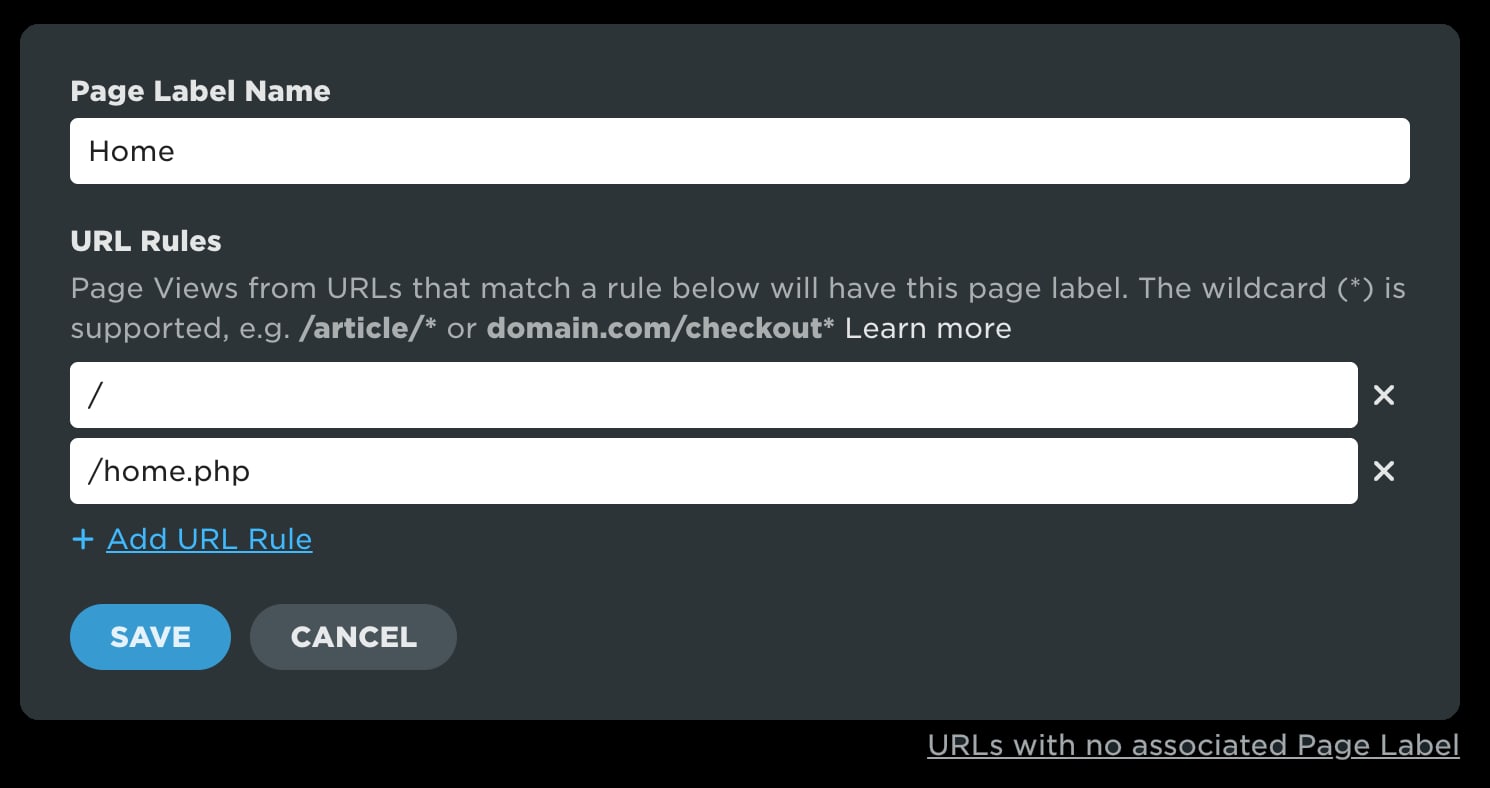
Next, create a Page Label name and enter in one or more URL rules. URL rules are defined by entering the path and (optionally) a wildcard (*). In the example below, we are matching on a trailing '/' or the path '/home.php' to define the 'Home' page label. Note that page rules are matched in order (first match whens). If you have patterns that match more than one url, the first rule in the list will be chosen.
Using an existing JavaScript variable on your pages
Pros: Uses common definition of a 'page' when using across toolsets (i.e. marketing analytics)
Cons: Limited by what exists on the page
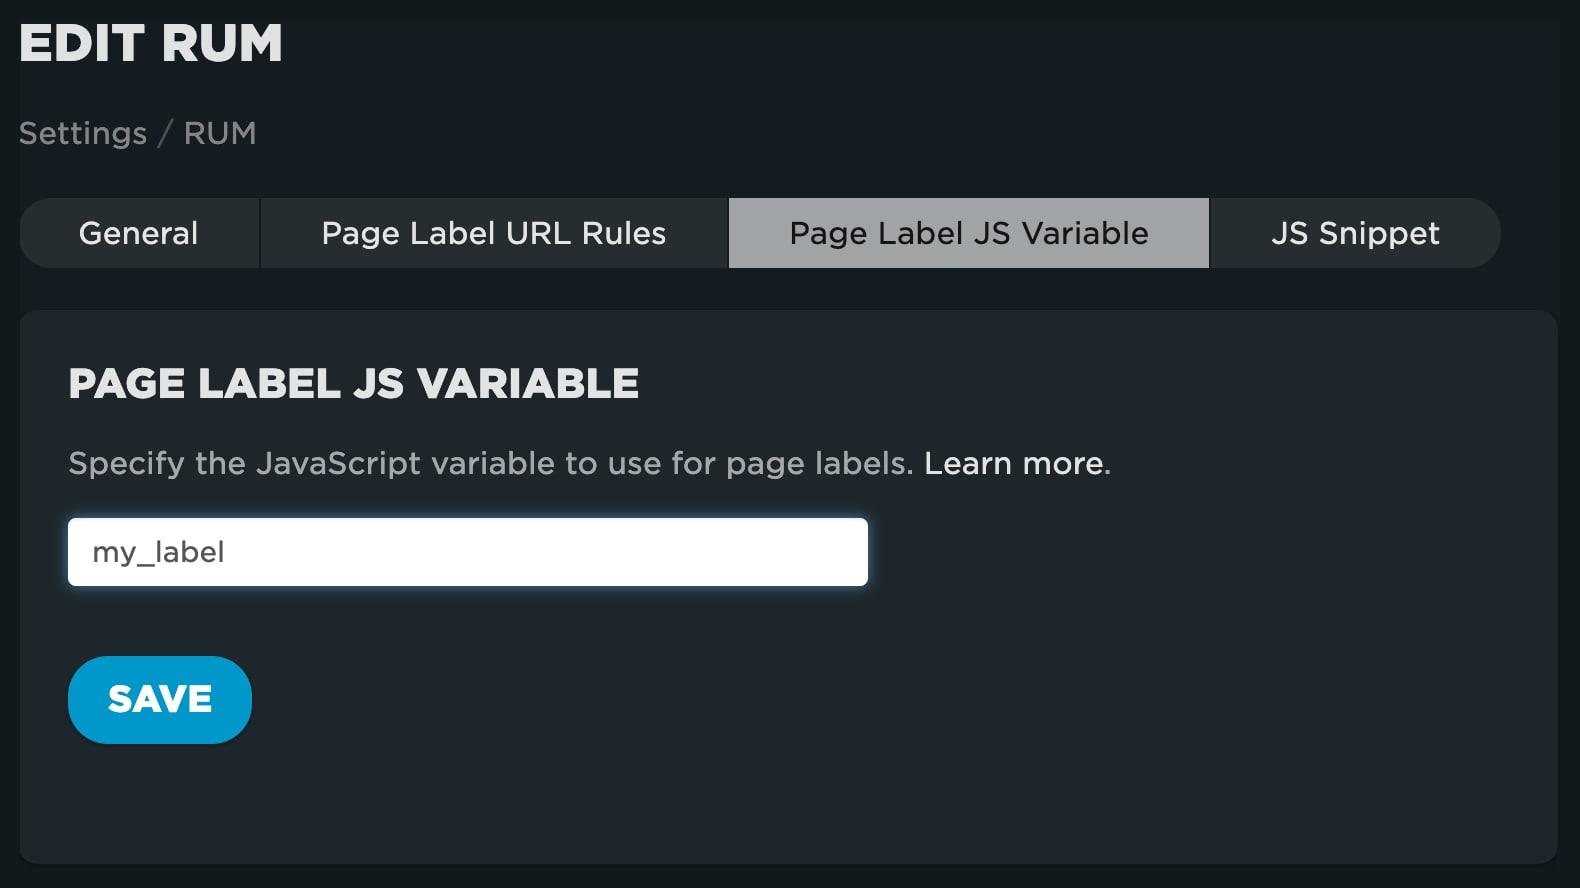
From the top menu of your RUM Settings, click on 'Page Label URL JS Variable', then simply type the name of the variable referenced within your page.
4 • Advanced RUM settings
The advanced tab contains settings that can be changed from the default values. For a full walkthrough see Advanced RUM settings.
Step 6 • Add Users, Admins and Teams
Remember, performance is a team sport! Now that you've configured SpeedCurve, you'll want to invite others to take part.
Adding Users
To add a new user, navigate to 'Team' from your account settings in the lower left corner.
Next, click on Users -> +ADD USER. Enter the name, email and select the permissions for the account (User or Team Admin). By default, users are read-only. This means they aren't able to edit the settings covered in this guide. If you select 'Team Admin', the user will have the ability to edit all Settings for the team.
Adding Org Admins
Org admins have all of the permissions of a Team Admin as well as the ability to manage Billing and Teams, and to view the Event log. To create a new Org Admin, navigate to 'Admin' from your account settings in the lower left corner and click on 'Admin'.
Next, click on Admins. Enter the name and email and click on the 'Add Admin' button.
Adding Teams
In some cases, it may make sense for you to create additional teams. This is typically done in an agency model, or within an organization that wants to keep performance data siloed. It's important to know that users can only see data for the Team(s) they are members of. Org Admins have the ability to access all Teams.
To create a new team, from the Admin menu, click on Teams -> +ADD TEAM. From there, you'll fill out the form for a new Team and then hit the 'Save' button.
Watch these videos for a walkthrough of your RUM Settings and Page Labels.
Learn more:
Updated 6 months ago
What’s Next
For more advance configuration, see the following: