Get aggregated RUM data.
This API allows to query aggregated metric data the similar way the Favorite charts work.
Overview
API Limitations
- Works only with RUM data (synthetic metrics are ignored).
- Requires a
chart_idfrom a chart previously created in the SpeedCurve UI. - Supports only charts that can be represented as a timeline or a single value (
timeseries,budget, andvaluechart types). - Returns a maximum of 200 data points (“buckets”). You can control the number of buckets by adjusting the requested date range (
start_timestampandend_timestamp) and thebucket_sizeparameter. - Bucket size interval ranges from 10 minutes to 31 days.
- Maximum date range is 3-13 months and determined by the data retention rules for your account.
Bucket size
What is a "bucket"?
The bucket is the time interval (sometimes called a "bin") used to group data points when generating a time-based chart. Instead of plotting every individual data point, the system collects all data that falls within each bucket interval (for example, 10 minutes, 30 minutes, or 1 day) and represents it as a single value on the chart.
For example, in the chart below the bucket size is 1 hour. Each point on the timeseries shows the aggregated value (the 75th percentile) of all page views collected within that hour.
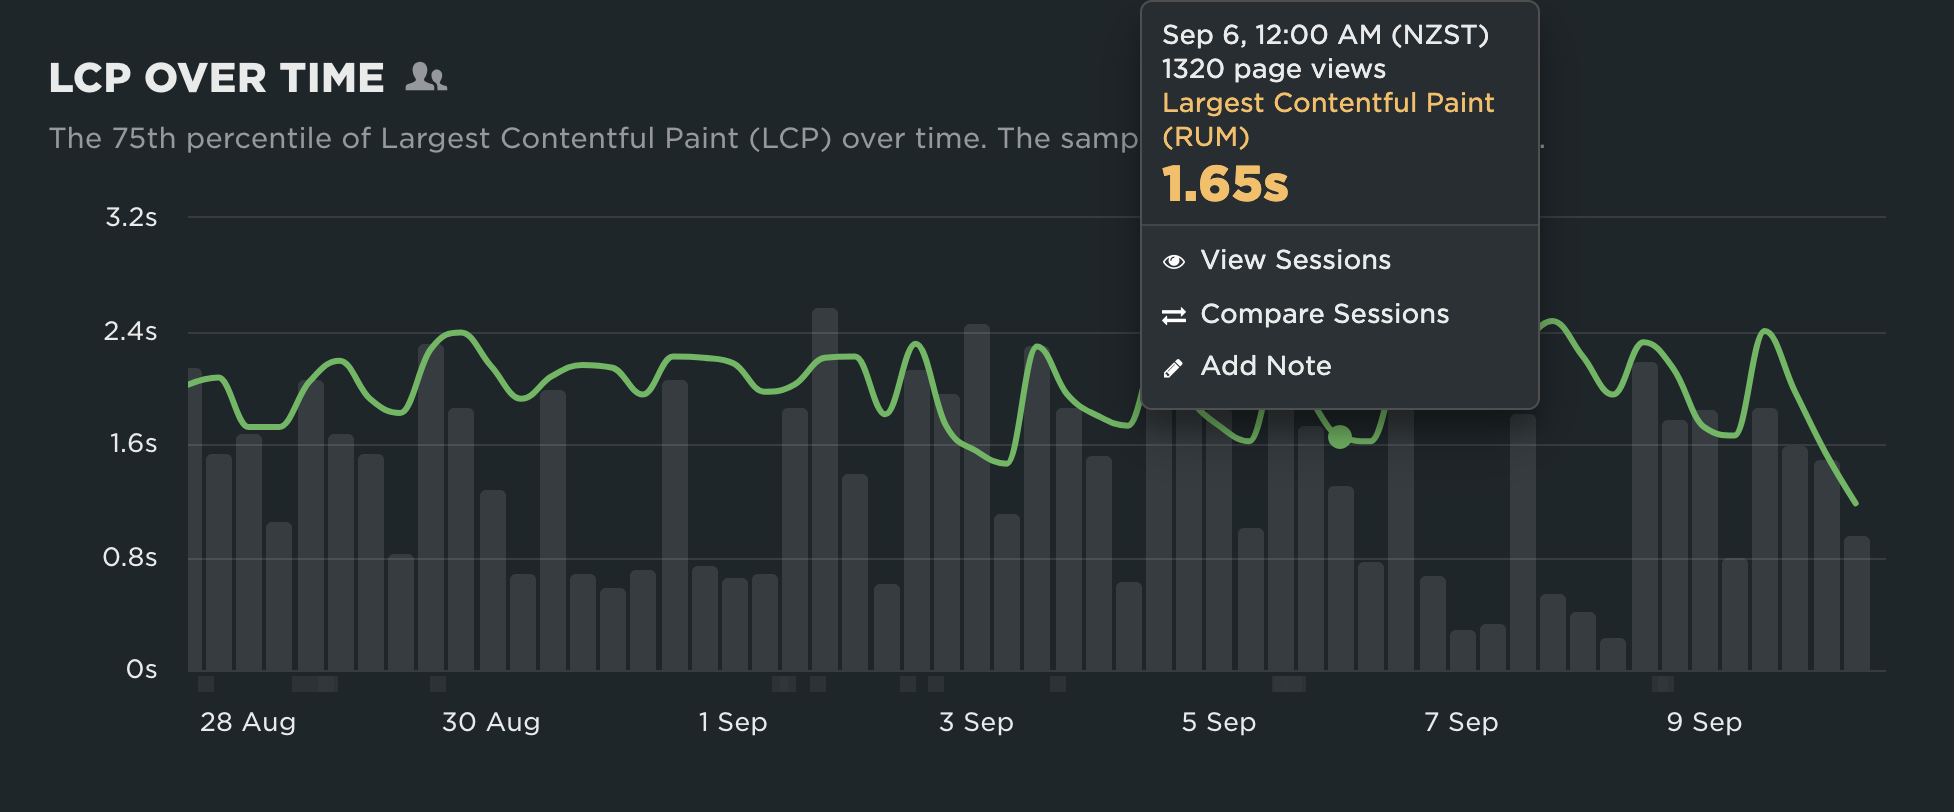
Using bucket sizes helps simplify and smooth out charts, making patterns and trends easier to see without overwhelming the visualization with raw data. Smaller bucket sizes provide more detailed resolution, while larger bucket sizes give a broader overview of long-term trends.
In the API response, each bucket is represented as a separate object within the data array:
                "data": [
                    {
                        "x": 1756166400000,
                        "y": 2.3,
                        "num": 2290
                    },
                    {
                        "x": 1756188000000,
                        "y": 1.96,
                        "num": 2392
                    },
                    {
                        "x": 1756209600000,
                        "y": 1.98,
                        "num": 1874
                    }
                ]
In this example, the "bucket size" is the difference between xvalue for each object, which is 6 hours.
Default bucket sizes
When you don't specify the bucket size in your request, the API will determine it automatically. Currently it supports the following predefined bucket sizes (in seconds):
- 1 hour — 3,600
- 2 hours — 7,200
- 6 hours — 21,600
- 12 hours — 43,200
- 1 day — 86,400
- 3 days — 259,200
- 1 week — 604,800
- 2 weeks — 1,209,600
- 1 month (30 days) — 2,592,000
Custom bucket sizes
You can specify any interval from 10 minutes to 31 days (in seconds) as a bucket size.
We recommend to use defined above bucket sizes to utilize the query cache.
Workflow
1. Client submits a query →POST /accounts/{account_id}/queries/
POST /accounts/{account_id}/queries/Parameters:
chart_id(integer) required - chart ID that can be obtained via the Dashboards API. Please note that the chart must first be created manually in the SpeedCurve app.start_timestamp(integer) - UNIX timestamp in seconds, by default 2 weeks ago.end_timestamp(integer) - UNIX timestamp in seconds, by default current time, rounded to the end of the last bucket.bucket_size(integer) - time interval in seconds for grouping the data
Server enqueues the query for processing.
Returns a 202 Accepted with a query_id and status.
{
    "data": {
        "query_id": "020d546d3743e85abd93eb9ac166559a846cdcdbb3cd0520babcc96bf71a7e17",
        "status": "waiting",
    }
}
If the same query was submitted before, statusmight have a different value.
See more: Create a query
2. Client polls for status → GET /accounts/{account_id}/queries/{query_id}/
GET /accounts/{account_id}/queries/{query_id}/Server returns current status: waiting, running, complete, error, cancelled
If the query completed, the server returns the results in the same response as series, where:
name(string) - the series ID (displayed as a chart legend in the SpeedCurve UI)metric(object) - the requested metric detailsdata(object[]) - the data for requested period with all chart filters applied.x(integer) - timestamp in millisecondsy(float) - aggregated valuenum(integer) - number of page views in that bucket
{
    "data": {
        "series": [
            {
                "name": "Largest Contentful Paint (RUM)",
                "metric": {
                    "metric": "lcp",
                    "name": "Largest Contentful Paint",
                    "full_name": "Largest Contentful Paint (RUM)"
                },
                "data": [
                    {
                        "x": 1756166400000,
                        "y": 2.3,
                        "num": 2290
                    },
                    {
                        "x": 1756188000000,
                        "y": 1.96,
                        "num": 2392
                    },
                    {
                        "x": 1756209600000,
                        "y": 1.98,
                        "num": 1874
                    },
                    {
                        "x": 1756231200000,
                        "y": 1.7,
                        "num": 1185
                    }
                ]
            }
        ],
        "query_id": "8377bbc5f5c526cc580dff99a9df90325351e67c7514fa36dc5883dcee535fad",
        "status": "complete"
    }
}
See more: Get query status / result