Deployment testing (Synthetic)
Test the performance of code changes on your staging environment during development and on your production site once you've set the code live.
How to test a deployment
You can trigger performance testing of your deployment in two ways:
- Integrate it into your CI/CD workflow
- Add a deploy within the UI. Below is the process for adding a deploy using the UI.
-
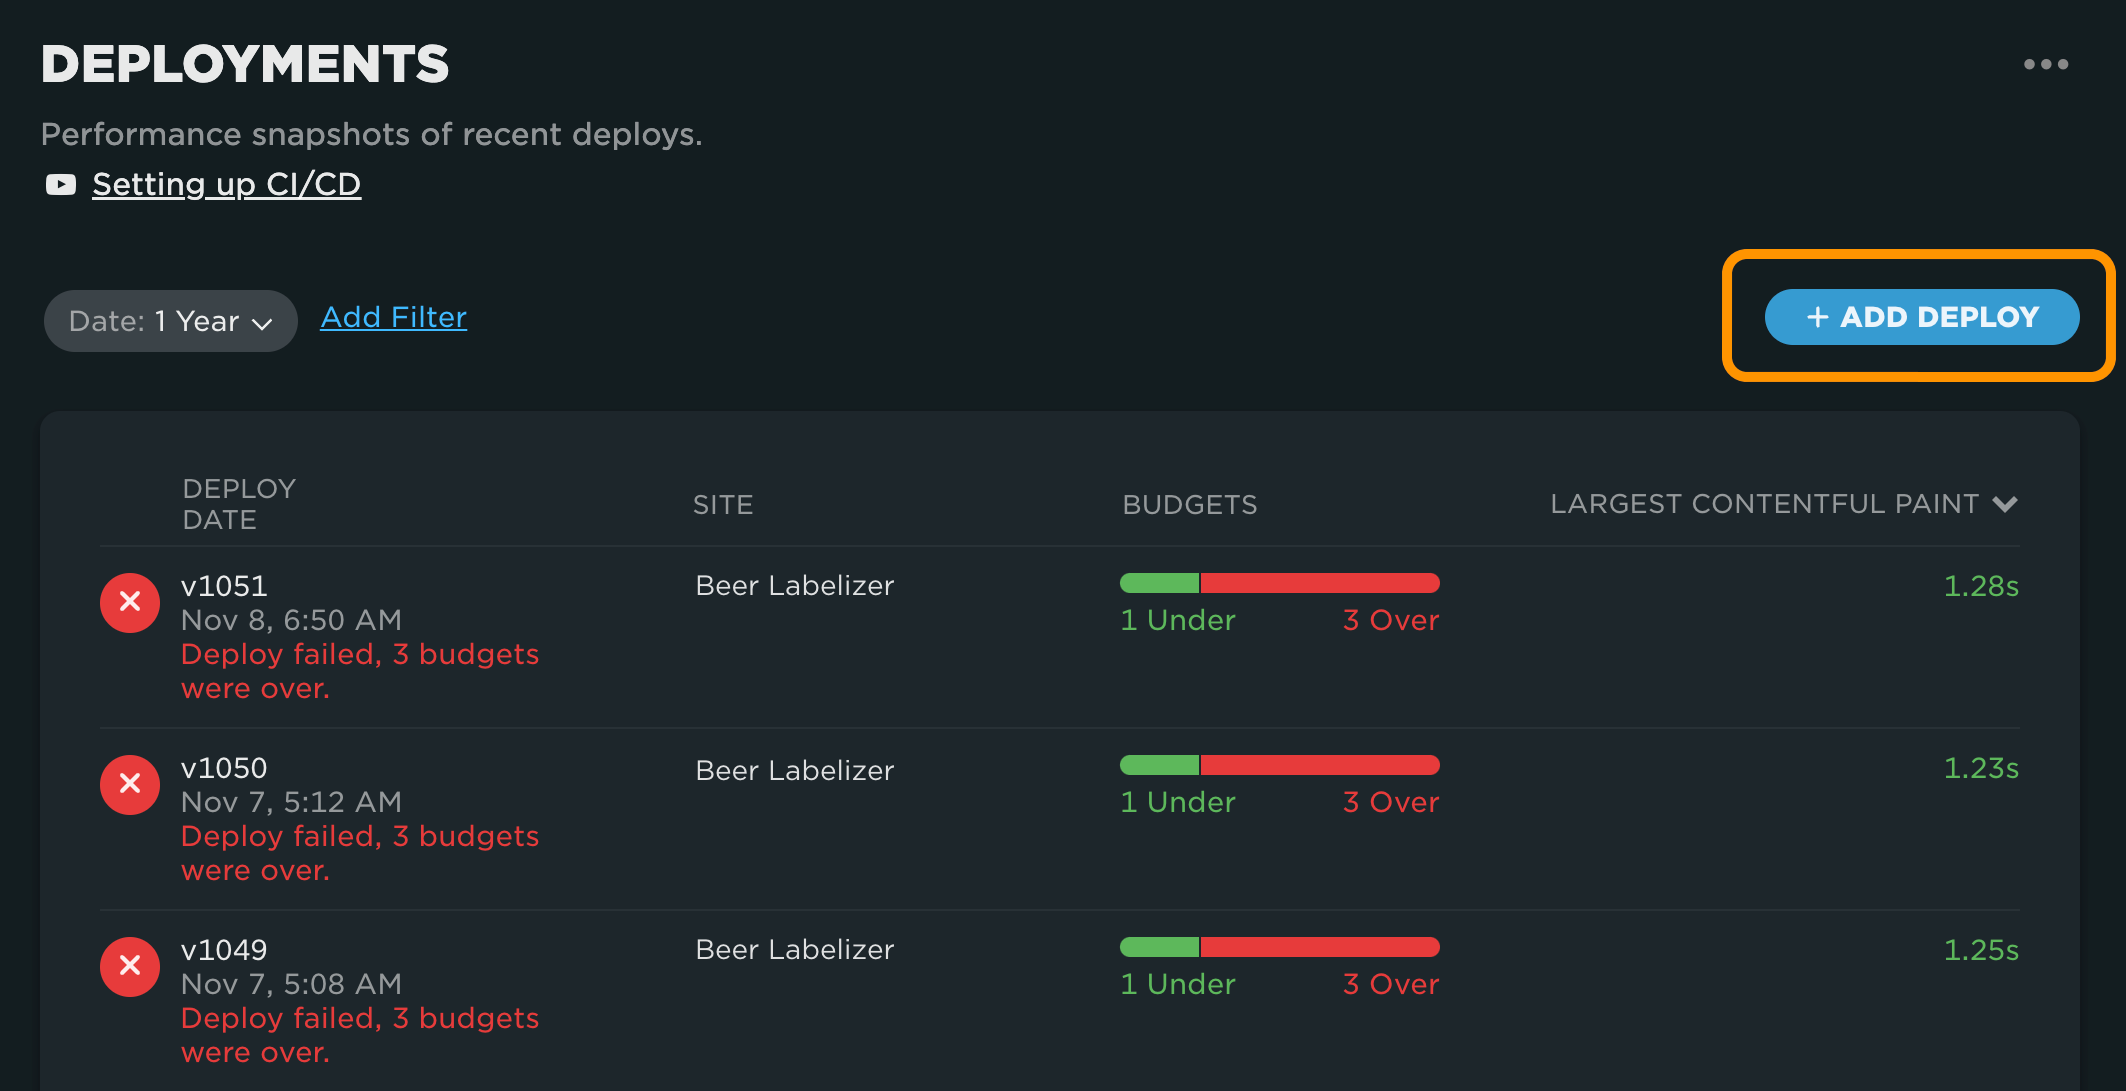
Navigate to the Deployments dashboard. In the top right you'll see the 'Add Deploy' button.
-
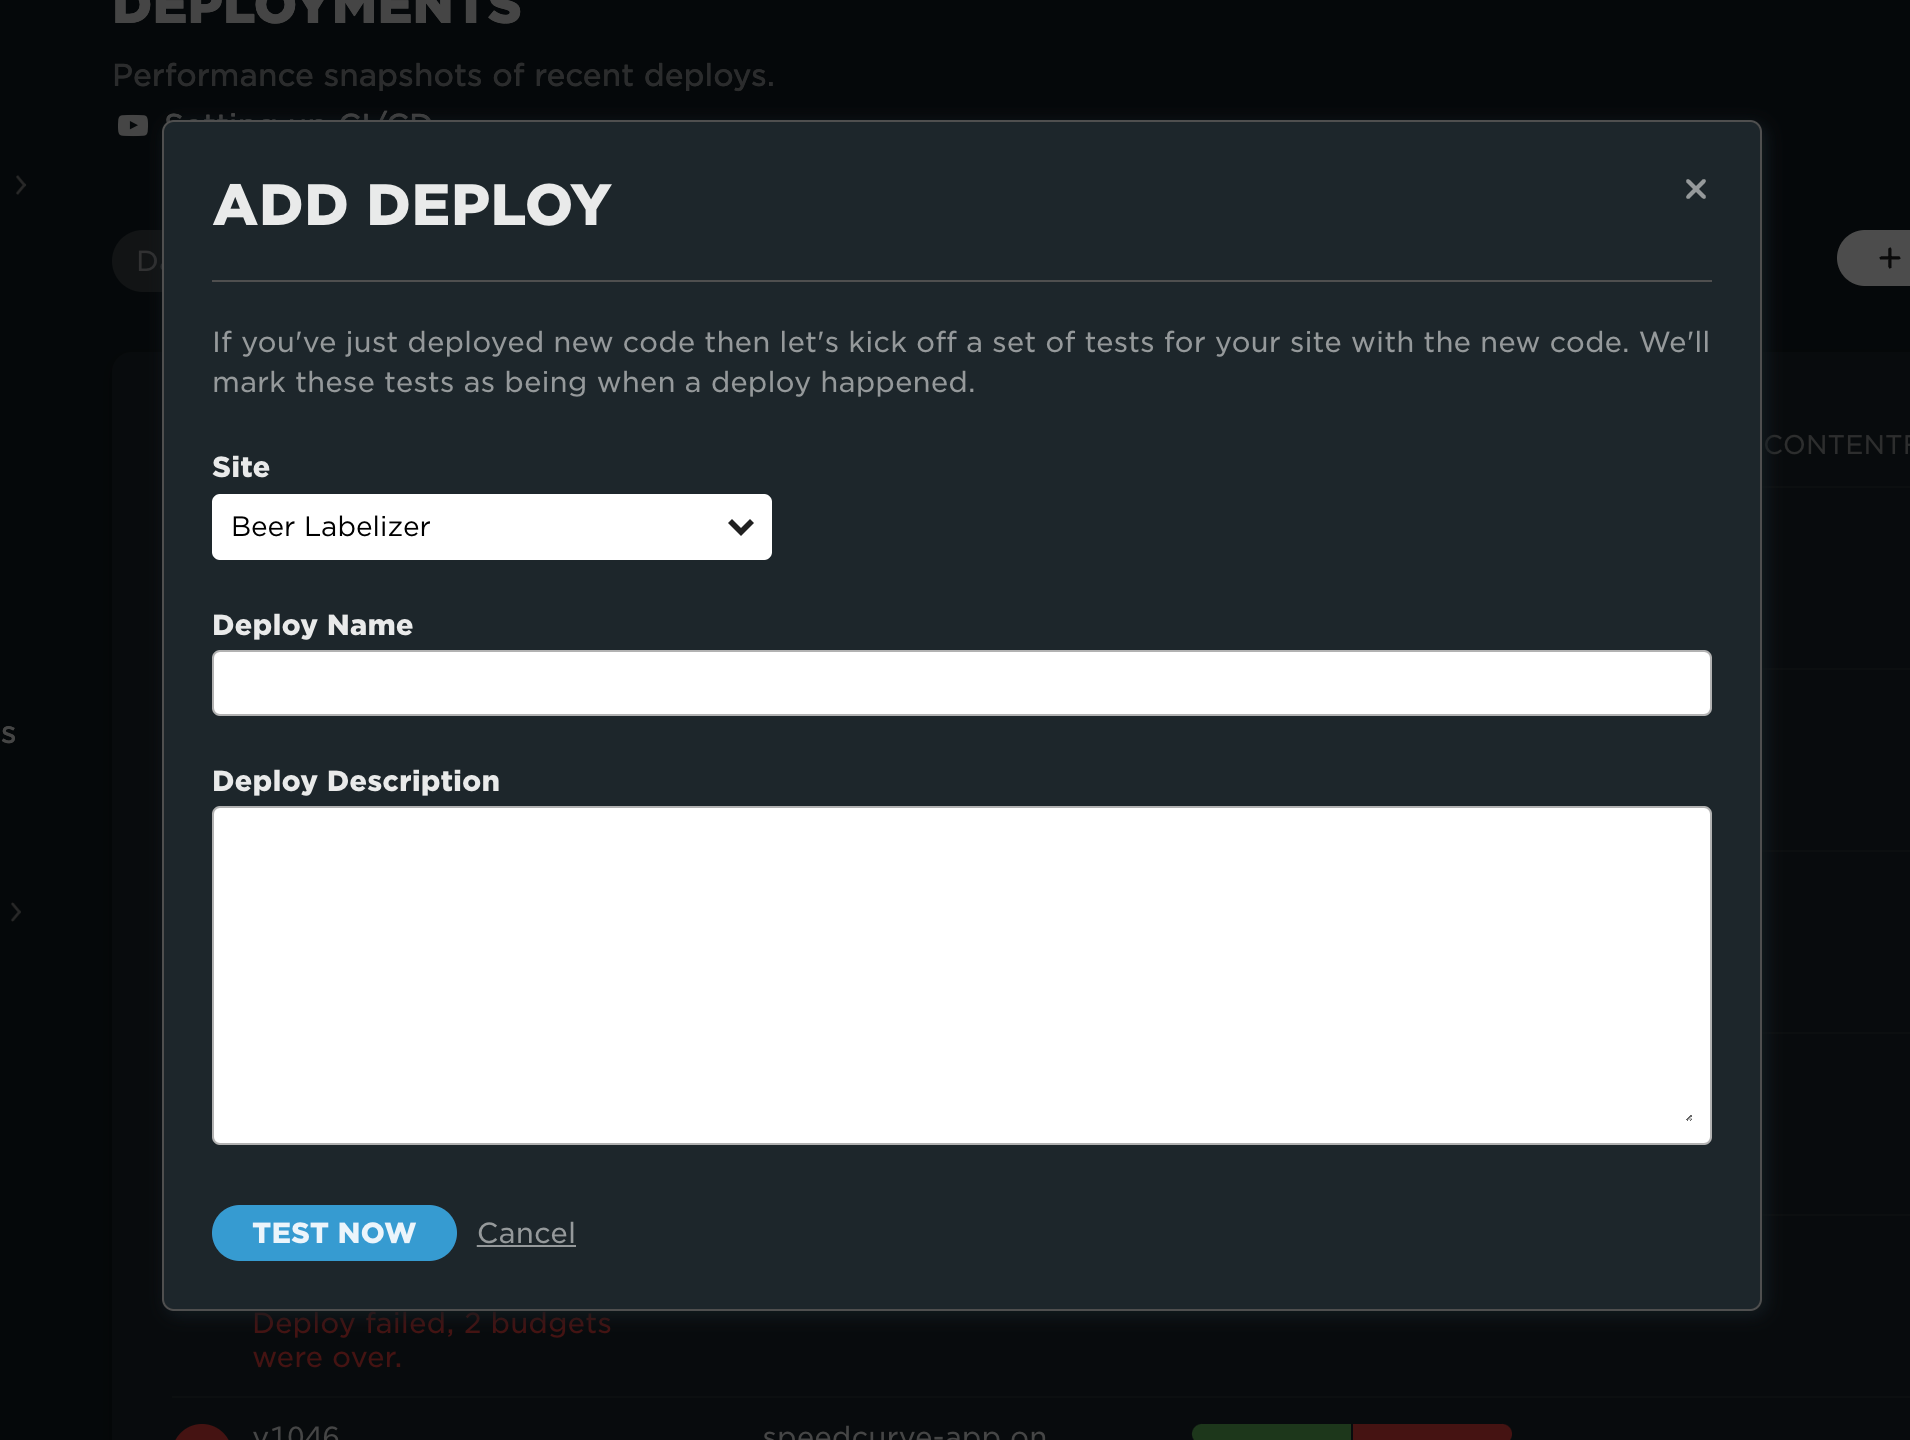
Within the 'Add Deploy' modal, select the site where your code was deployed. This is the site that will be tested. (Optional: Add a deploy name and description.) Then click the 'Test Now' button to begin deployment testing.
-
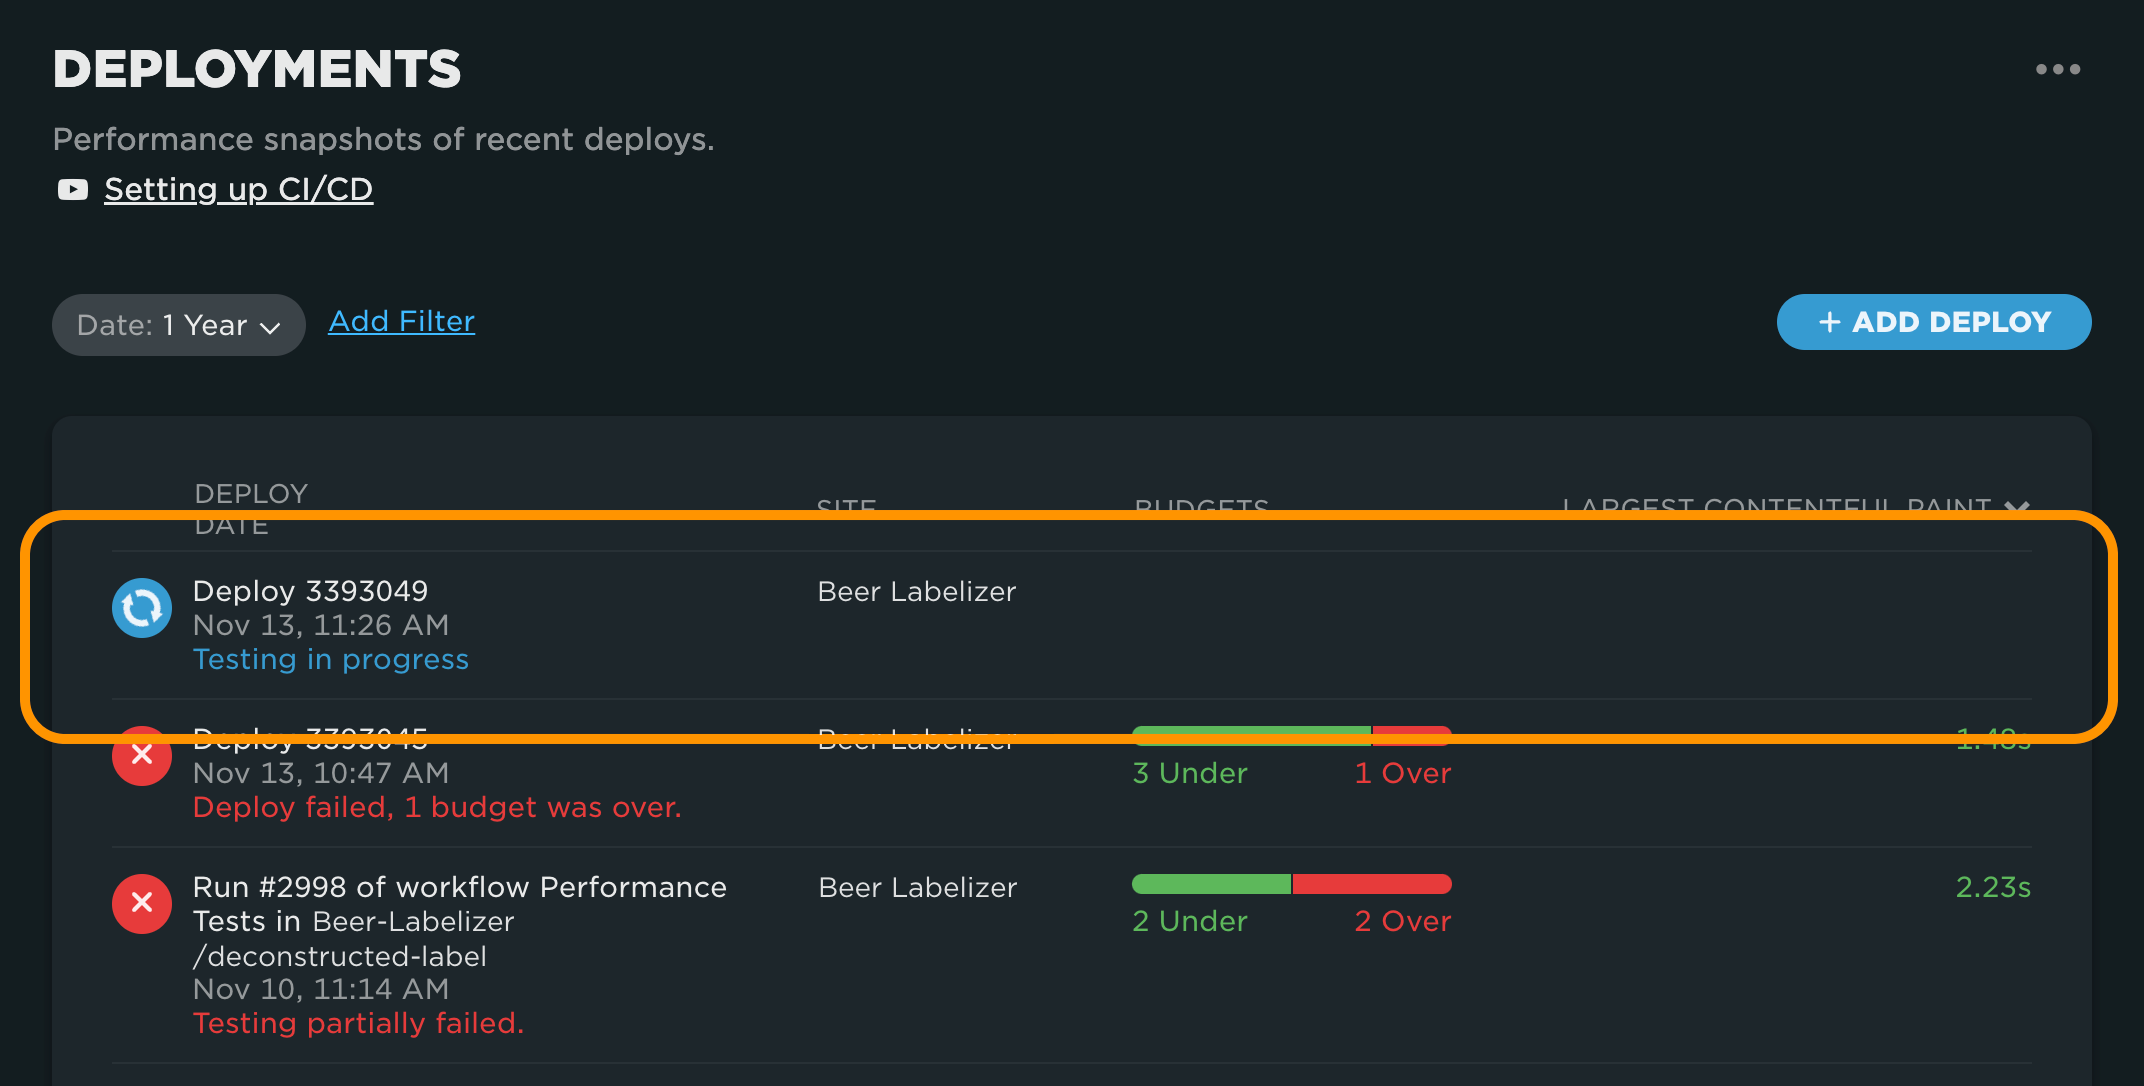
You'll be taken back to the Deployments dashboard with your new deploy sitting at the top of the list. You'll notice it's in the 'Testing in progress' state. It can take a while to test all the different URLs associated with the site, but once testing is complete you'll see your deployment update. Click on the deploy to see the results of your test.
Deployment Details dashboard
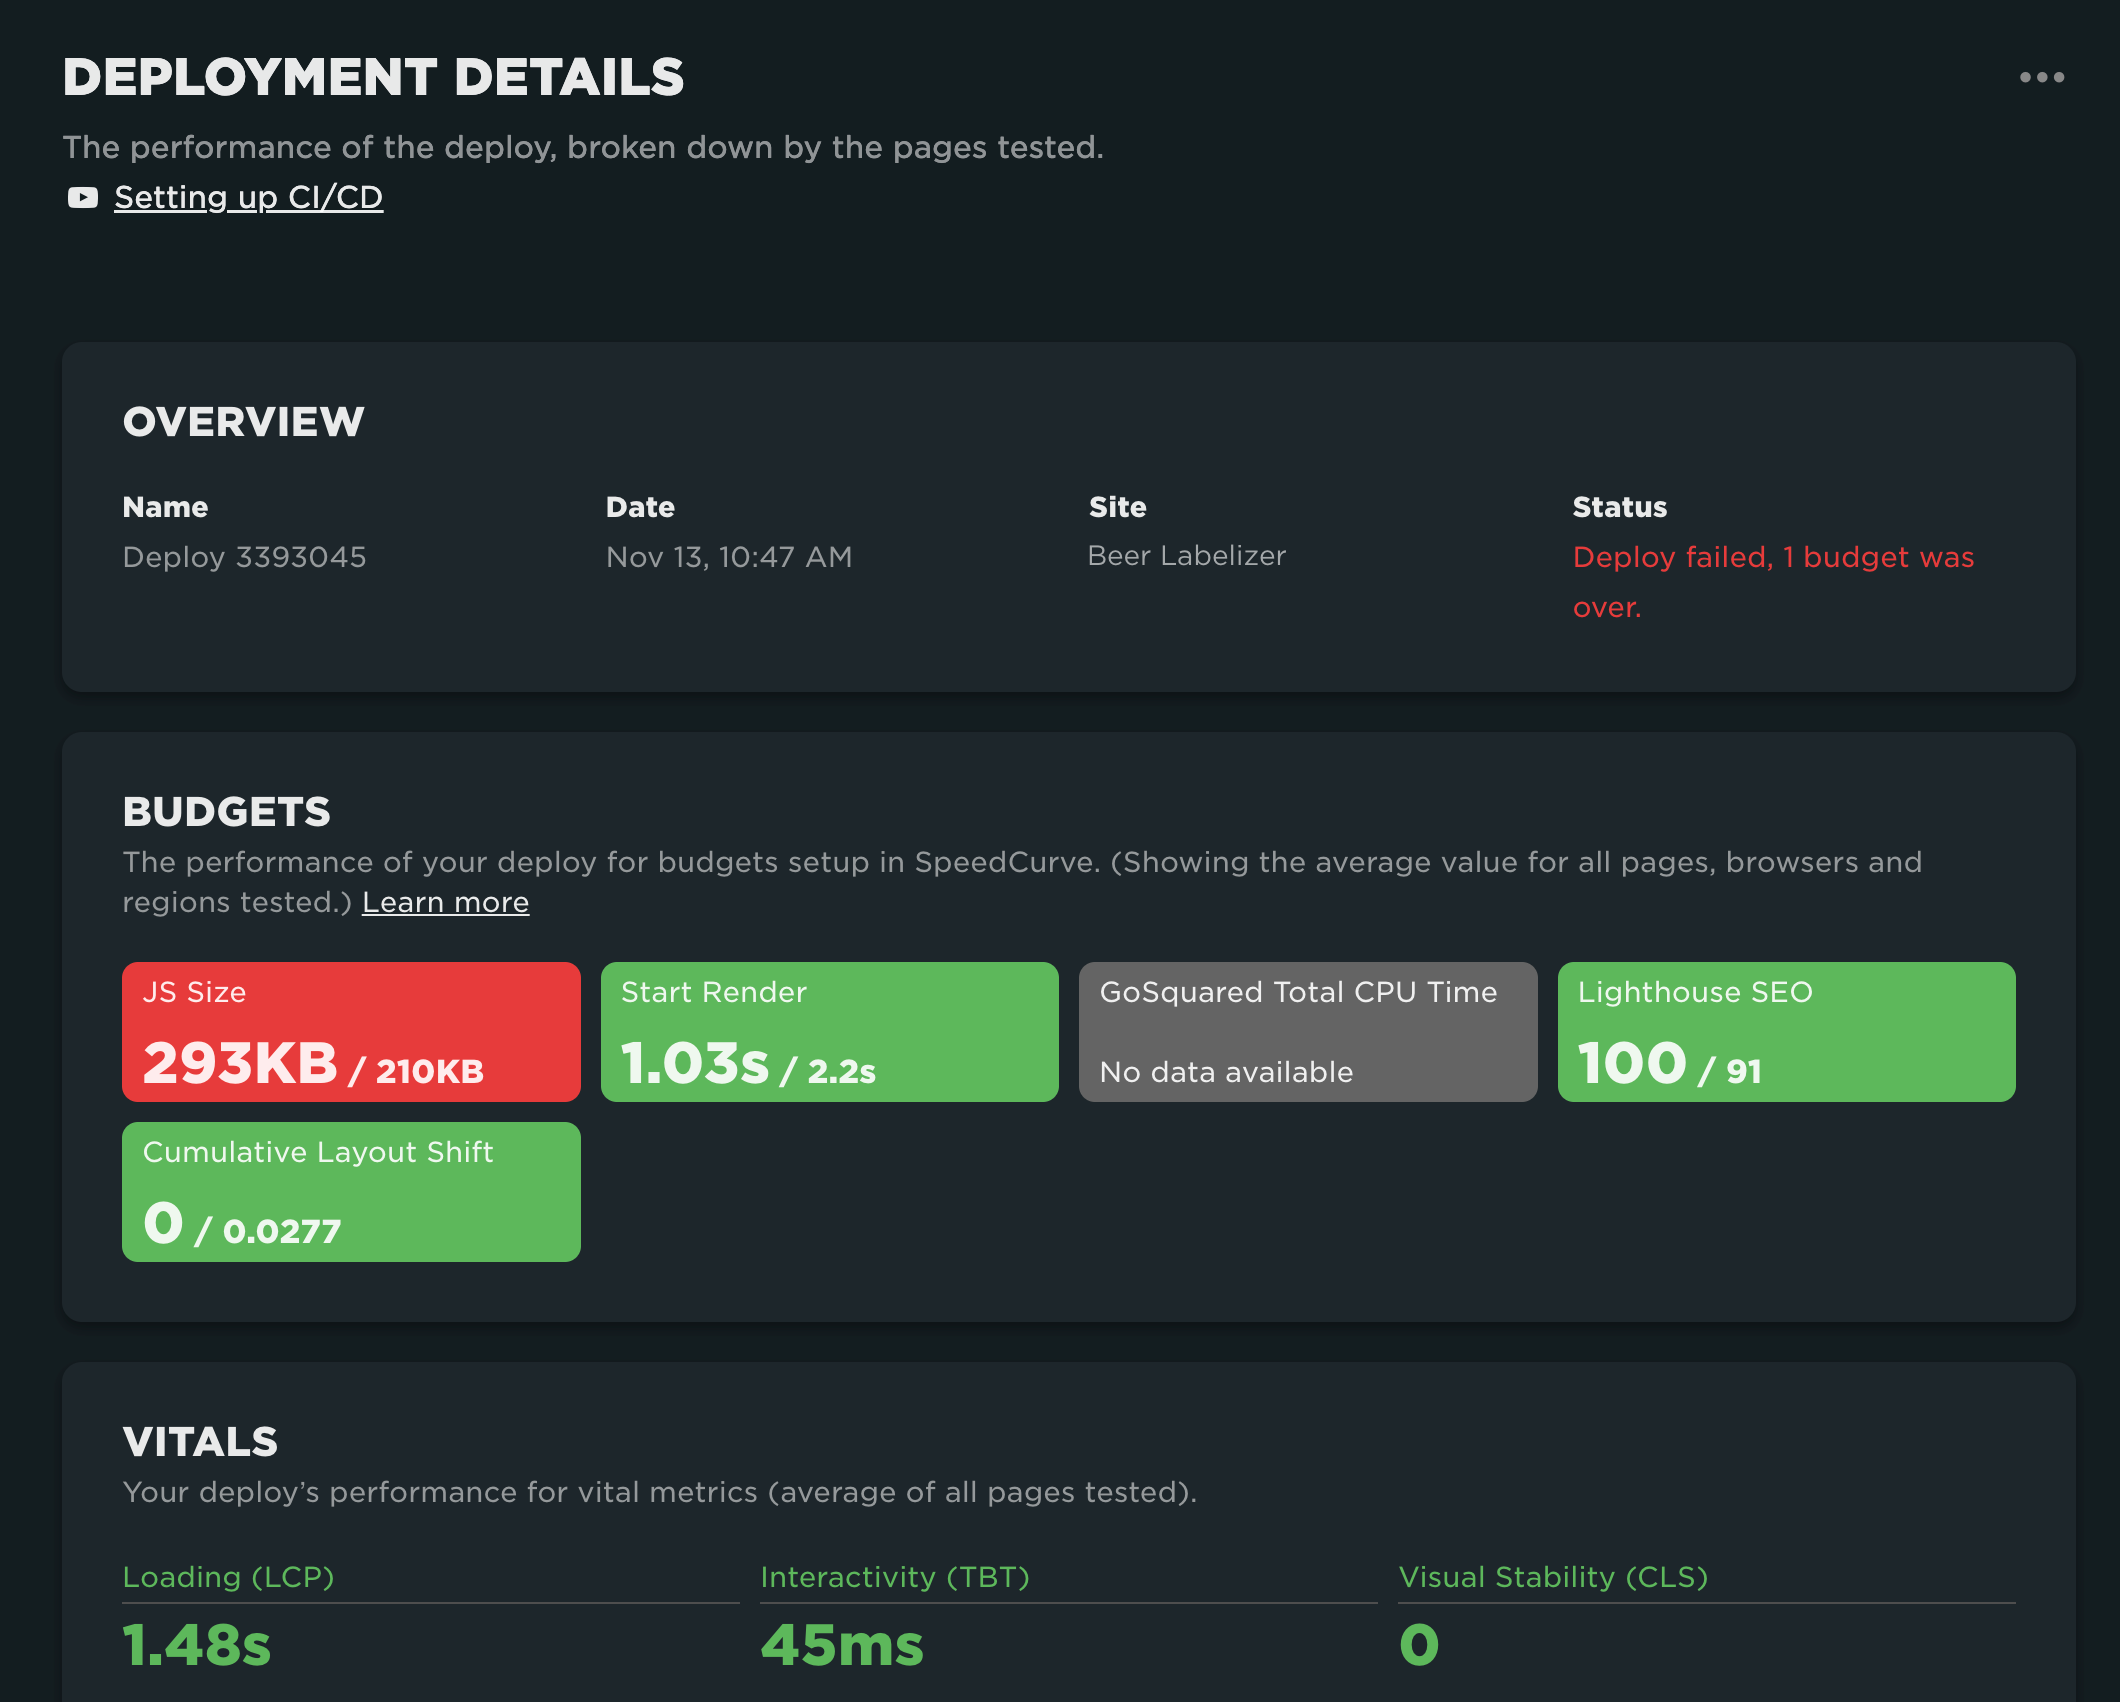
After you've finished testing of a deploy, it's time to look at the results of your testing. When you click on a deploy in the Deployments dashboard you'll be taken to the Deployment Details Dashboard. This dashboard breaks down the pages tested in your deploy.
At the top of the dashboard, you'll see overview information about your deploy, including deploy name and description, when the testing took place, and the deploy status.
Deploy Status
The deploy status is linked to the performance budgets being tested for the deploy. The deploy needs to pass all the budgets to have a successful status.
Budgets
The performance budgets that are tested as part of the deploy are derived from the site being tested. Any performance budgets set up on the site that are site wide will be tested as part of the deploy. For the deployment status to be successful, all budgets must be passed (green).
Please note budgets for specific page labels, regions, or browsers are not included in the deploy testing.
The metric values on the budgets in Deployment Details dashboard are the average of all tests.
Vitals
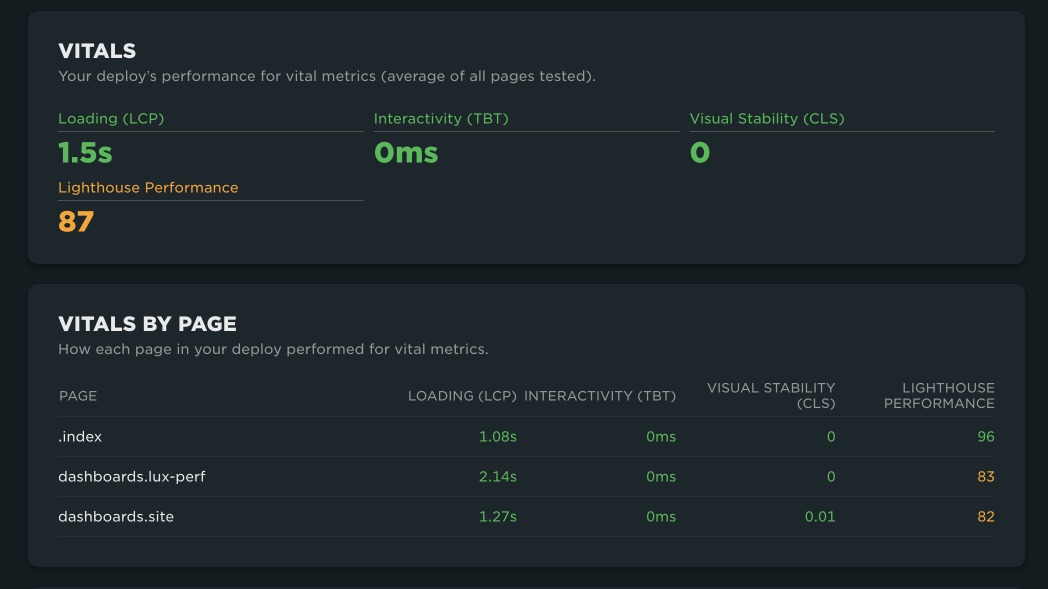
You'll also see the deploy's performance for Core Web Vitals (Largest Contentful Paint, Total Blocking Time, and Content Layout Shift), as well as the Lighthouse Performance score. You'll see both the average across all pages tested in the deploy and a breakdown for each page tested. This is a great way to identify which pages are causing poor performance for a deploy. This also makes it easier to identify code that is causing performance issues.
Filmstrips
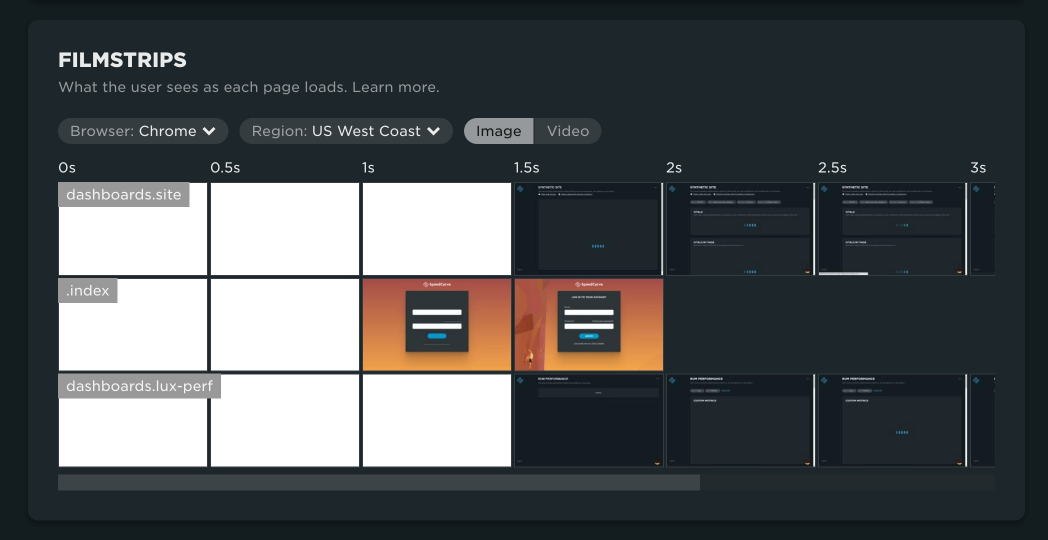
The filmstrip shows what the user sees as each page in the deployment loads. This helps you spot page construction issues in your code that might be delaying page load. It also provides a quick visual confirmation that pages are loading and rendering as expected. You can update the filmstrip view to see any of the browsers or regions tested.
Content Sizes
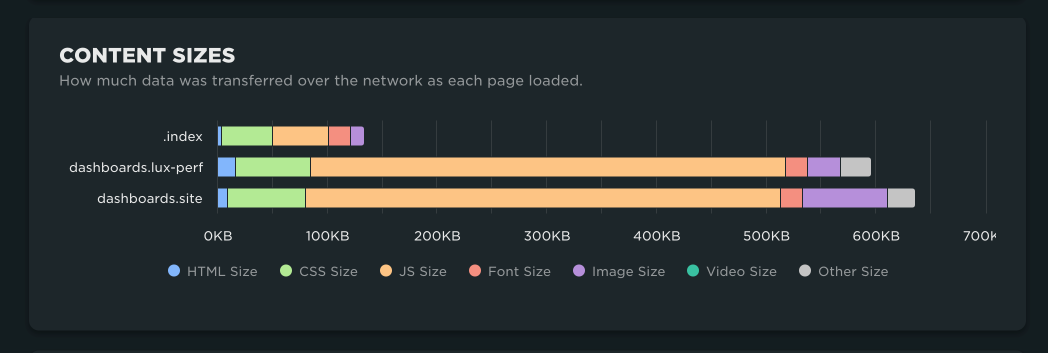
Make sure code in the deployment hasn't caused pages to become bloated in file size. Content sizes are broken down by page and then file type to make it easier to identify which files have caused a file size increase.
Improvements
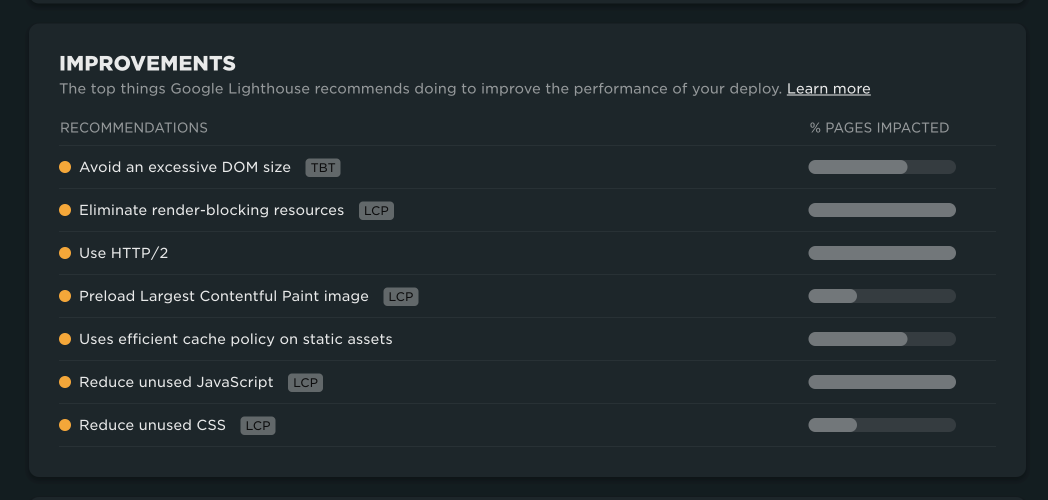
These are the top Google Lighthouse recommendations for improving the performance of the deploy. We also show you the percentage of pages affected by each recommendation. The higher the percentage, the more pages that are affected by the recommendation. We suggest that you tackle the red recommendations (the most pages affected) first. Click on each recommendation to get a more detailed explanation of the recommendation, along with a list of the specific pages that it affects.
Metrics
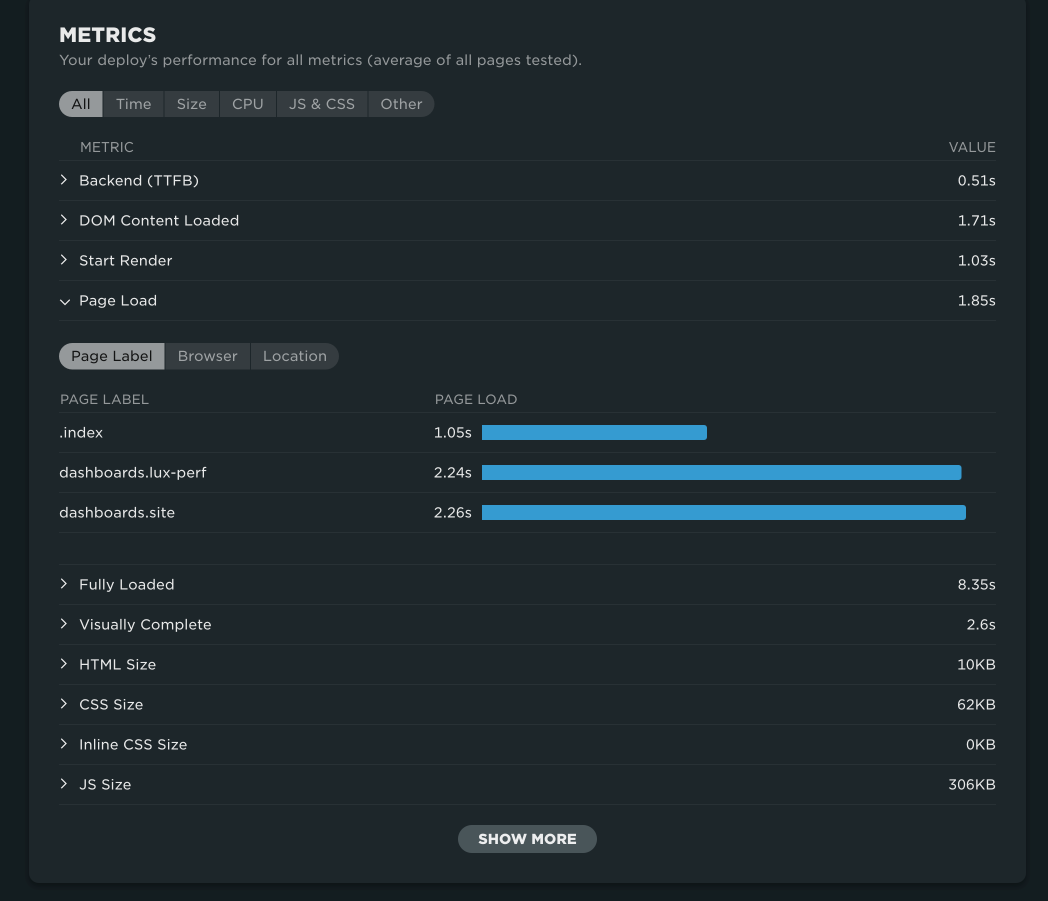
These are all the performance metrics captured for the deploy. If you see a metric that seems out of the ordinary, click on it to see the metric broken down by page label, browser, and region. That way you can start to identify what the cause of the poor performance might be. Is it code on a certain page? Your CDN's performance in a specific location? Or something else?
Updated 5 months ago